Miscellaneous manufacturing
Industry profile, February 2020
Sections: Description | Pricing | Costs | Demand | Appendix
This page is an industry profile for the Miscellaneous manufacturing industry. It provides a general economic overview of recent developments in the industry. This includes information on industry pricing, costs, and demand. Below you will find a description of what type of business establishments are included in this industry. For information on how to best utilize this industry profile please visit our Business Solutions.
Industry Description
Industries in the Miscellaneous Manufacturing subsector make a wide range of products that cannot readily be classified in specific NAICS subsectors in manufacturing. Processes used by these establishments vary significantly, both among and within industries. For example, a variety of manufacturing processes are used in manufacturing sporting and athletic goods that include products such as tennis racquets and golf balls. The processes for these products differ from each other, and the processes differ significantly from the fabrication processes used in making dolls or toys, the melting and shaping of precious metals to make jewelry, and the bending, forming, and assembly used in making medical products.
This industry description was sourced from the North American Industry Classification System.
To download this data, or to learn more about how pricing is measured, please contact us.
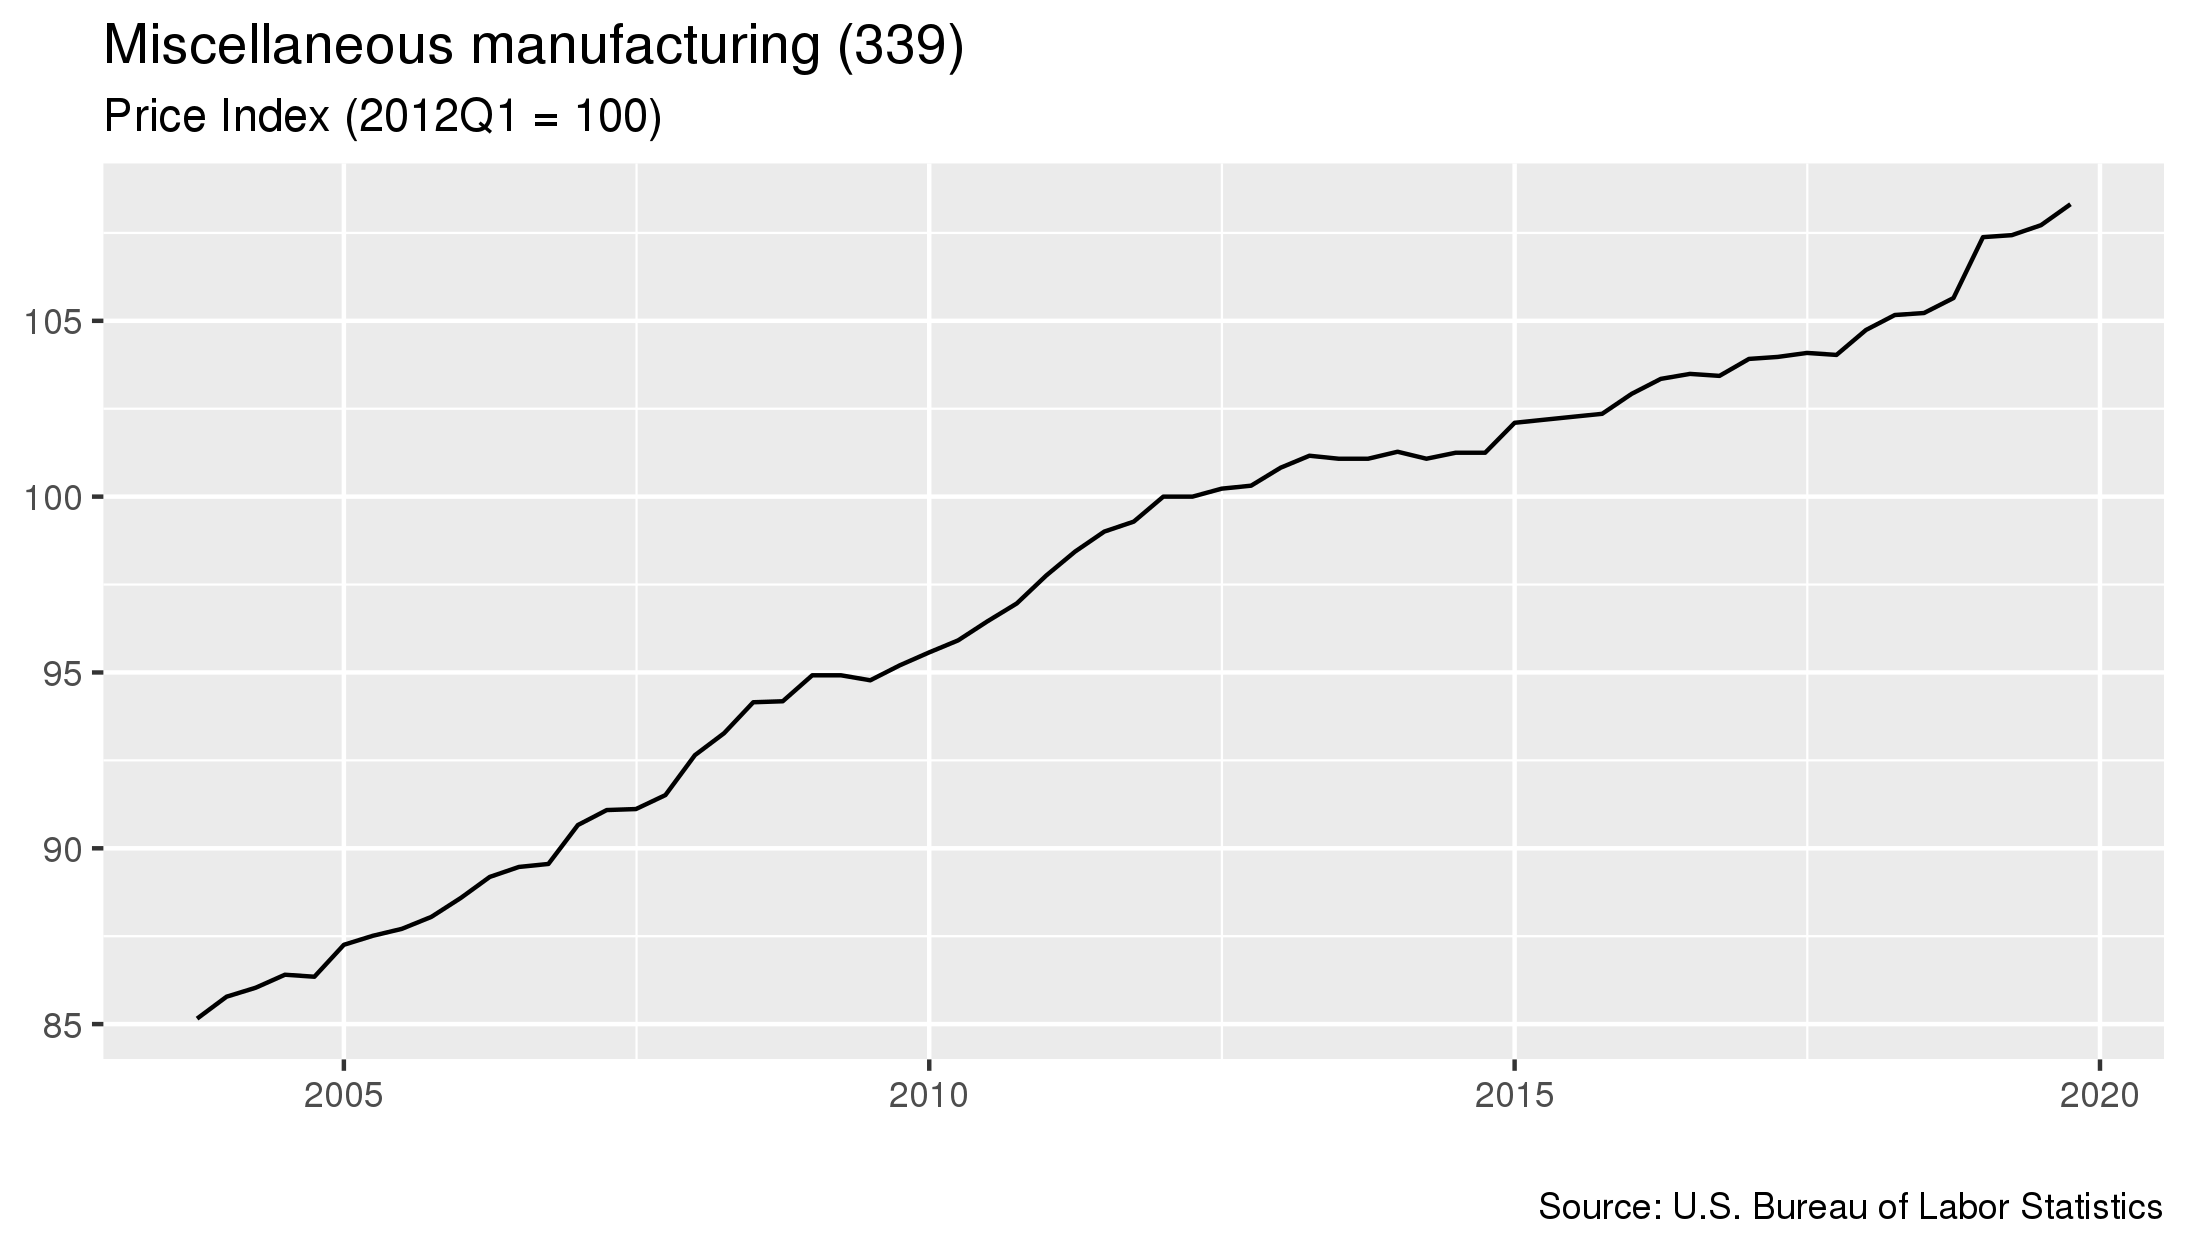
- As of January 2020, prices in this industry had increased 0.6 percent since the previous quarter.
- From January 2019 to January 2020 prices in this industry increased 2.5 percent.
- Prices increased 5.8 percent in the five year period starting in January 2015 and ending in January 2020.
To download this data, or to learn more about how costs for this industry are measured, please contact us.
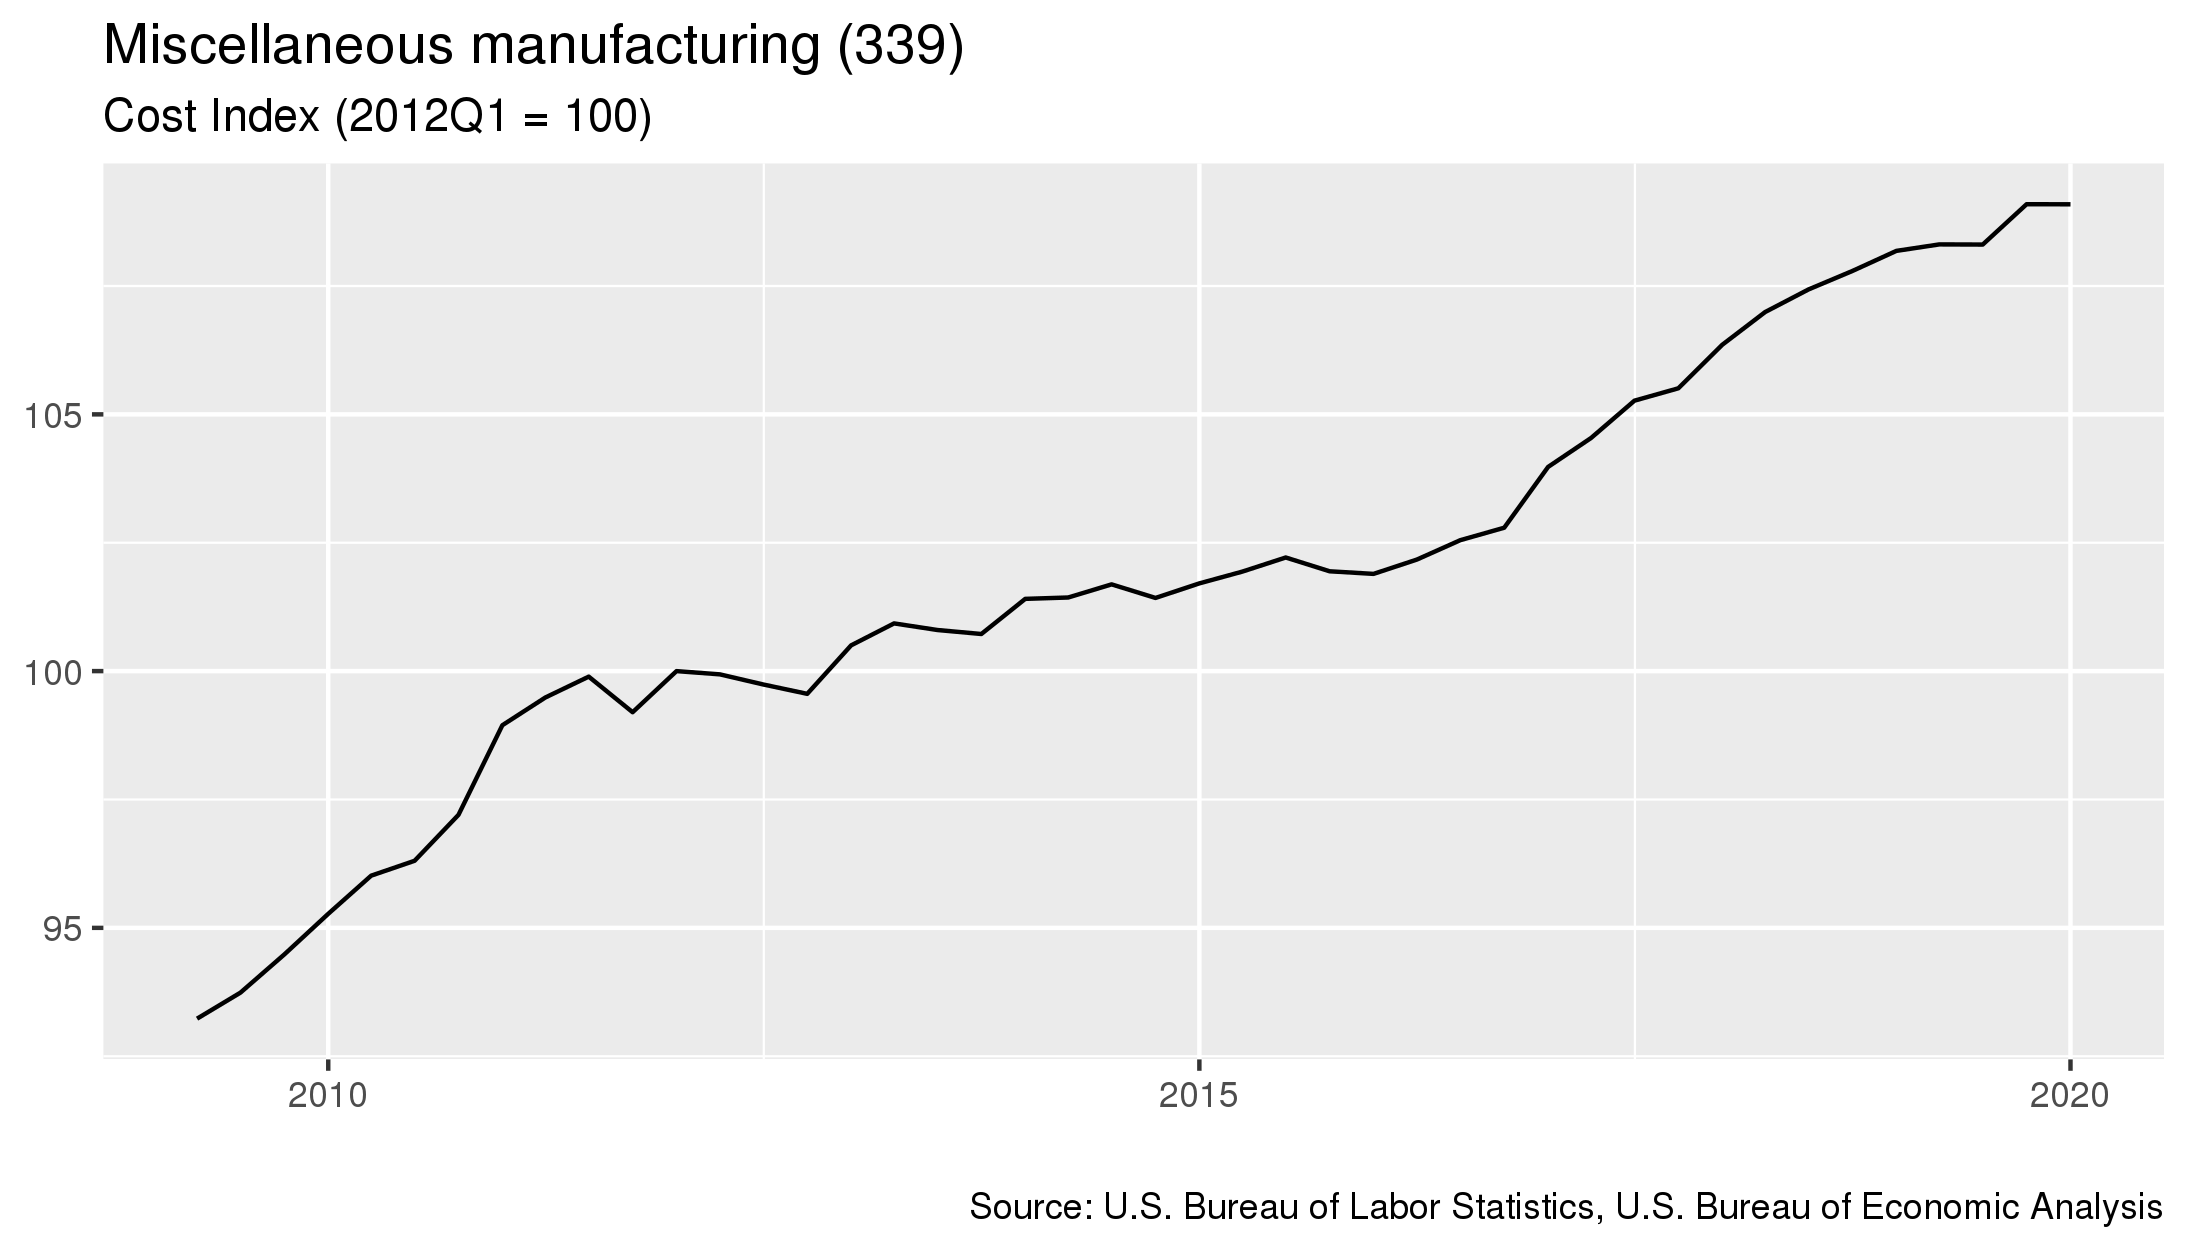
- As of January 2020, costs in this industry had 0 percent since the previous quarter.
- From January 2019 to January 2020 costs in this industry increased 0.8 percent.
- Costs increased 7.1 percent in the five year period starting in January 2015 and ending in January 2020.
For details on which industries are included in each sector, click here
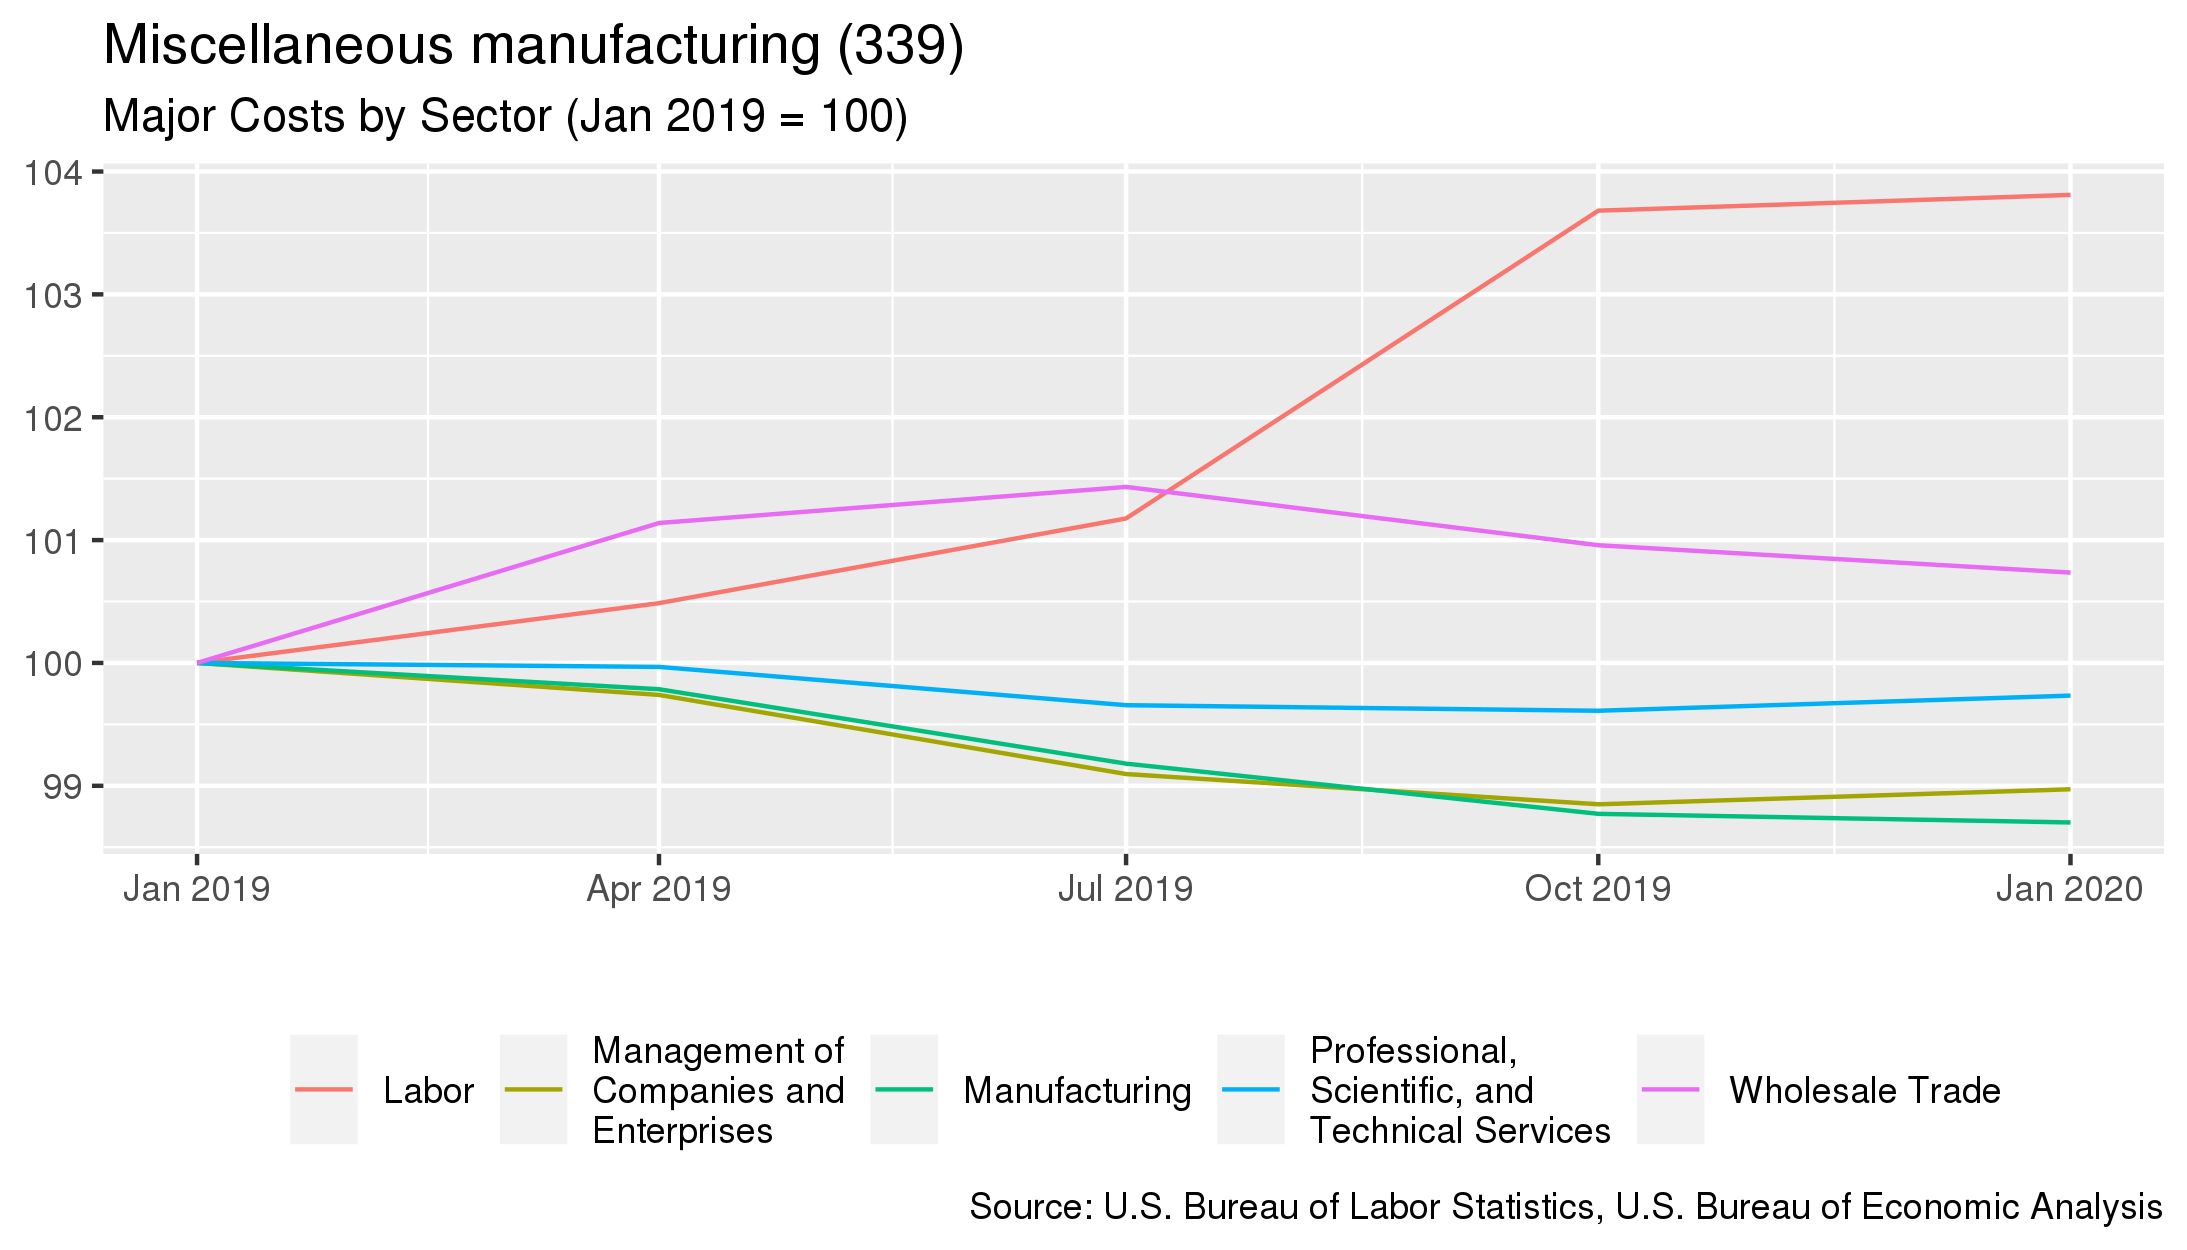
- The largest cost for this industry is purchases made to the Labor sector. This sector accounts for 42.2% of the industry's overall costs.
- From January 2019 to January 2020, the largest change in costs for this industry were costs associated with purchases to the Labor sector. Costs associated with this sector increased 3.8%.
| Sector Name | Percentage of Costs | Annual Percent Change 4 |
|---|---|---|
| Labor | 42.2% | +3.8% |
| Manufacturing | 39.2% | -1.3% |
| Professional, Scientific, and Technical Services | 5.4% | -0.3% |
| Management of Companies and Enterprises | 2.8% | -1% |
| Wholesale Trade | 2% | +0.7% |
To download this data, or to learn more about how demand for this industry is measured, please contact us.
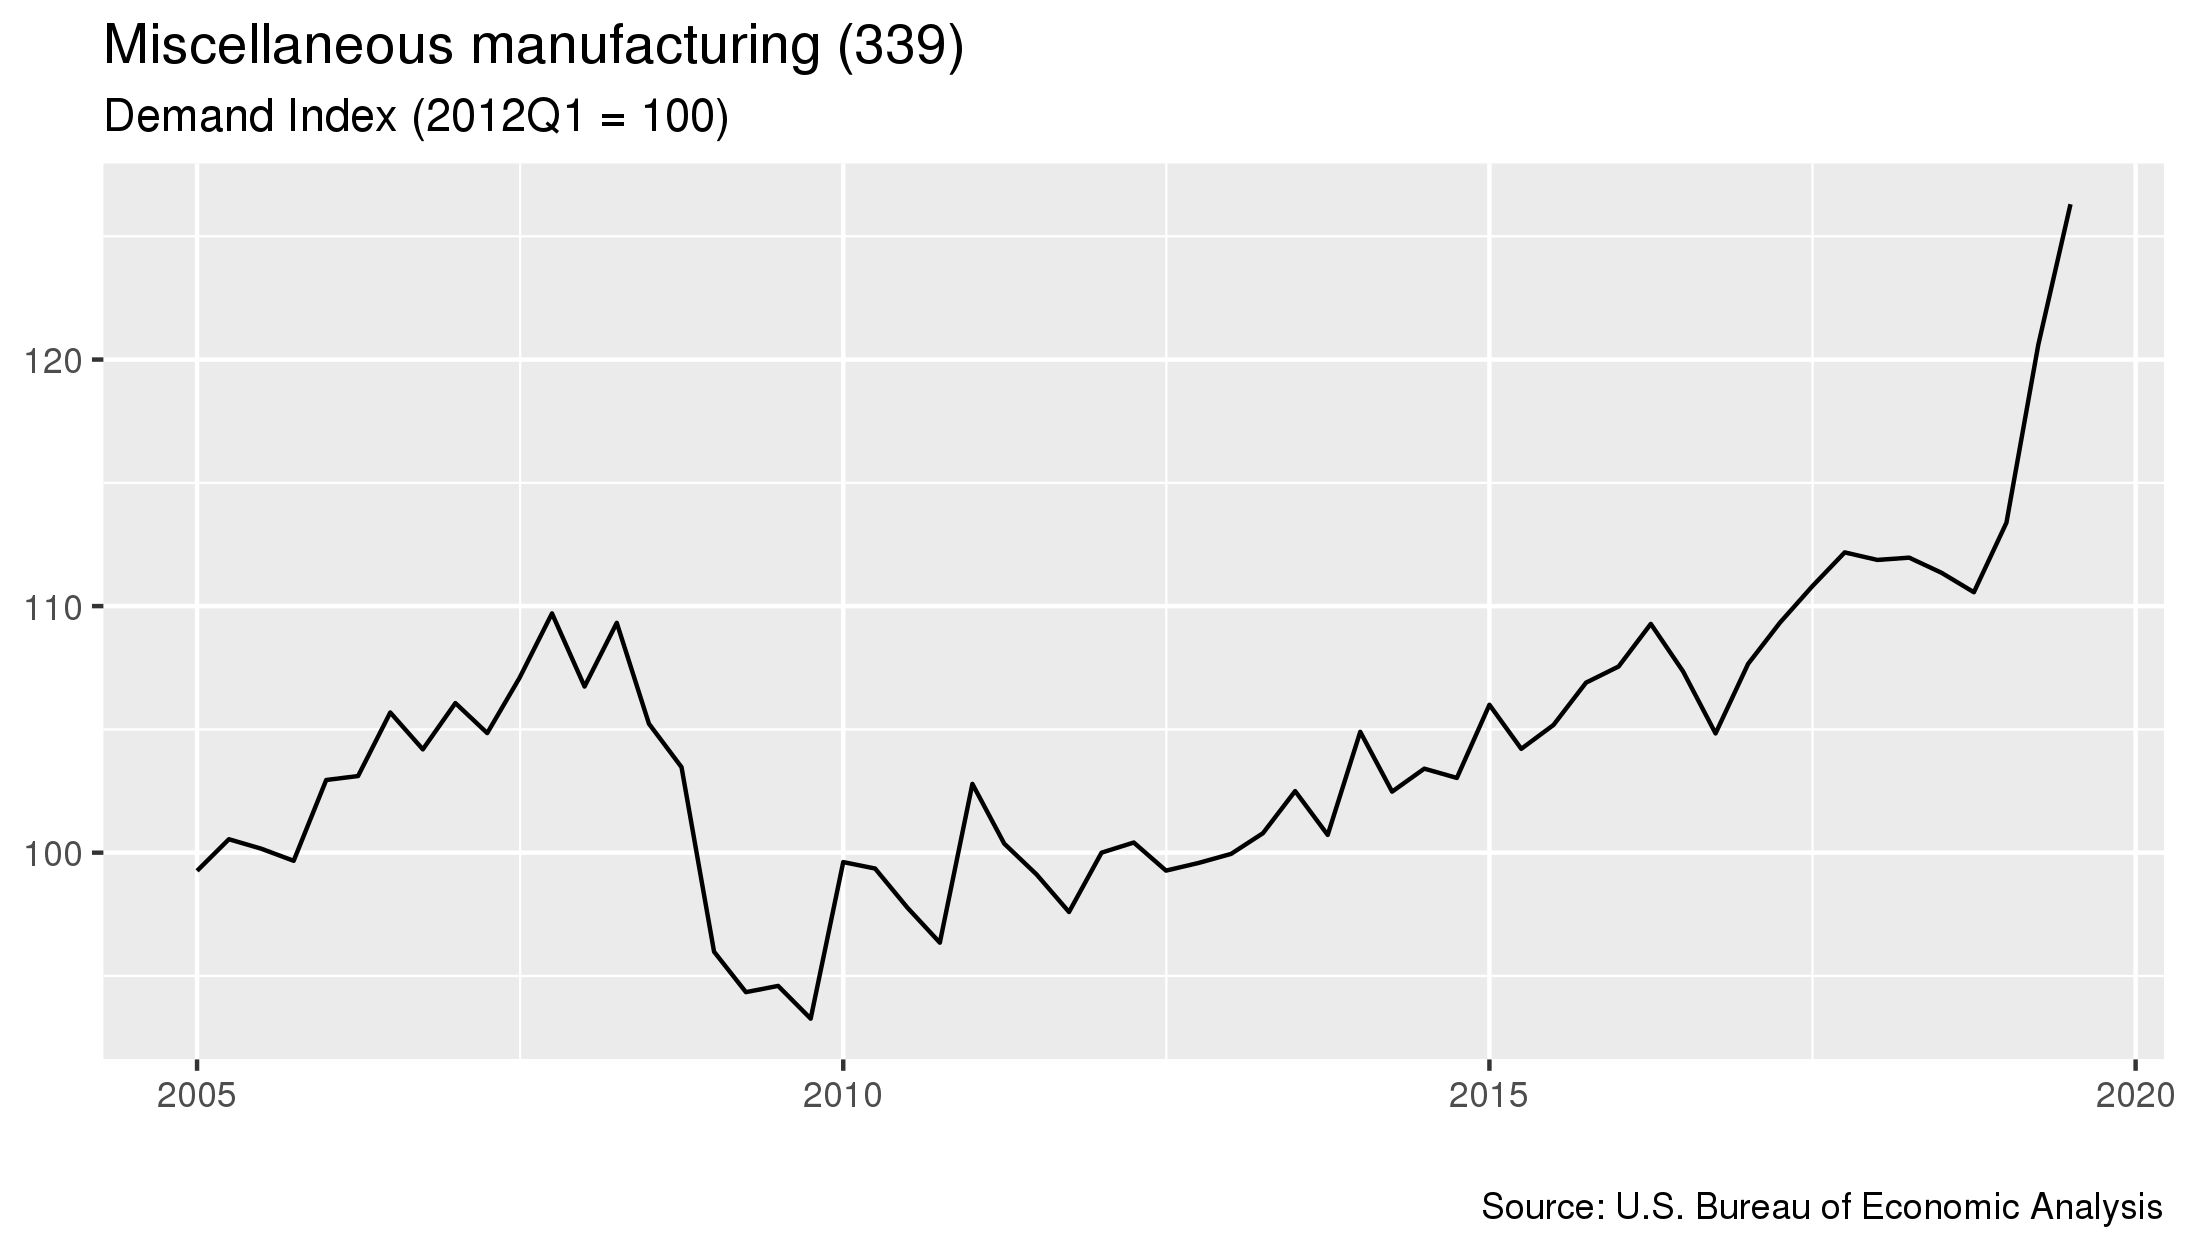
- As of July 2019, demand for this industry had increased 4.7 percent since the previous quarter.
- From July 2018 to January 2020 costs in this industry increased 13.4 percent.
- Costs increased 20.1 percent in the five year period starting in July 2014 and ending in July 2019.
For details on which industries are included in each sector, click here
- The sector that contributes the most to this industry's demand is the Personal consumption sector. This sector accounts for 48.5% of the industry's overall demand.
- From January 2019 to January 2020, the largest change in demand for this industry was from the Exports sector, where demand increased 45.2%.
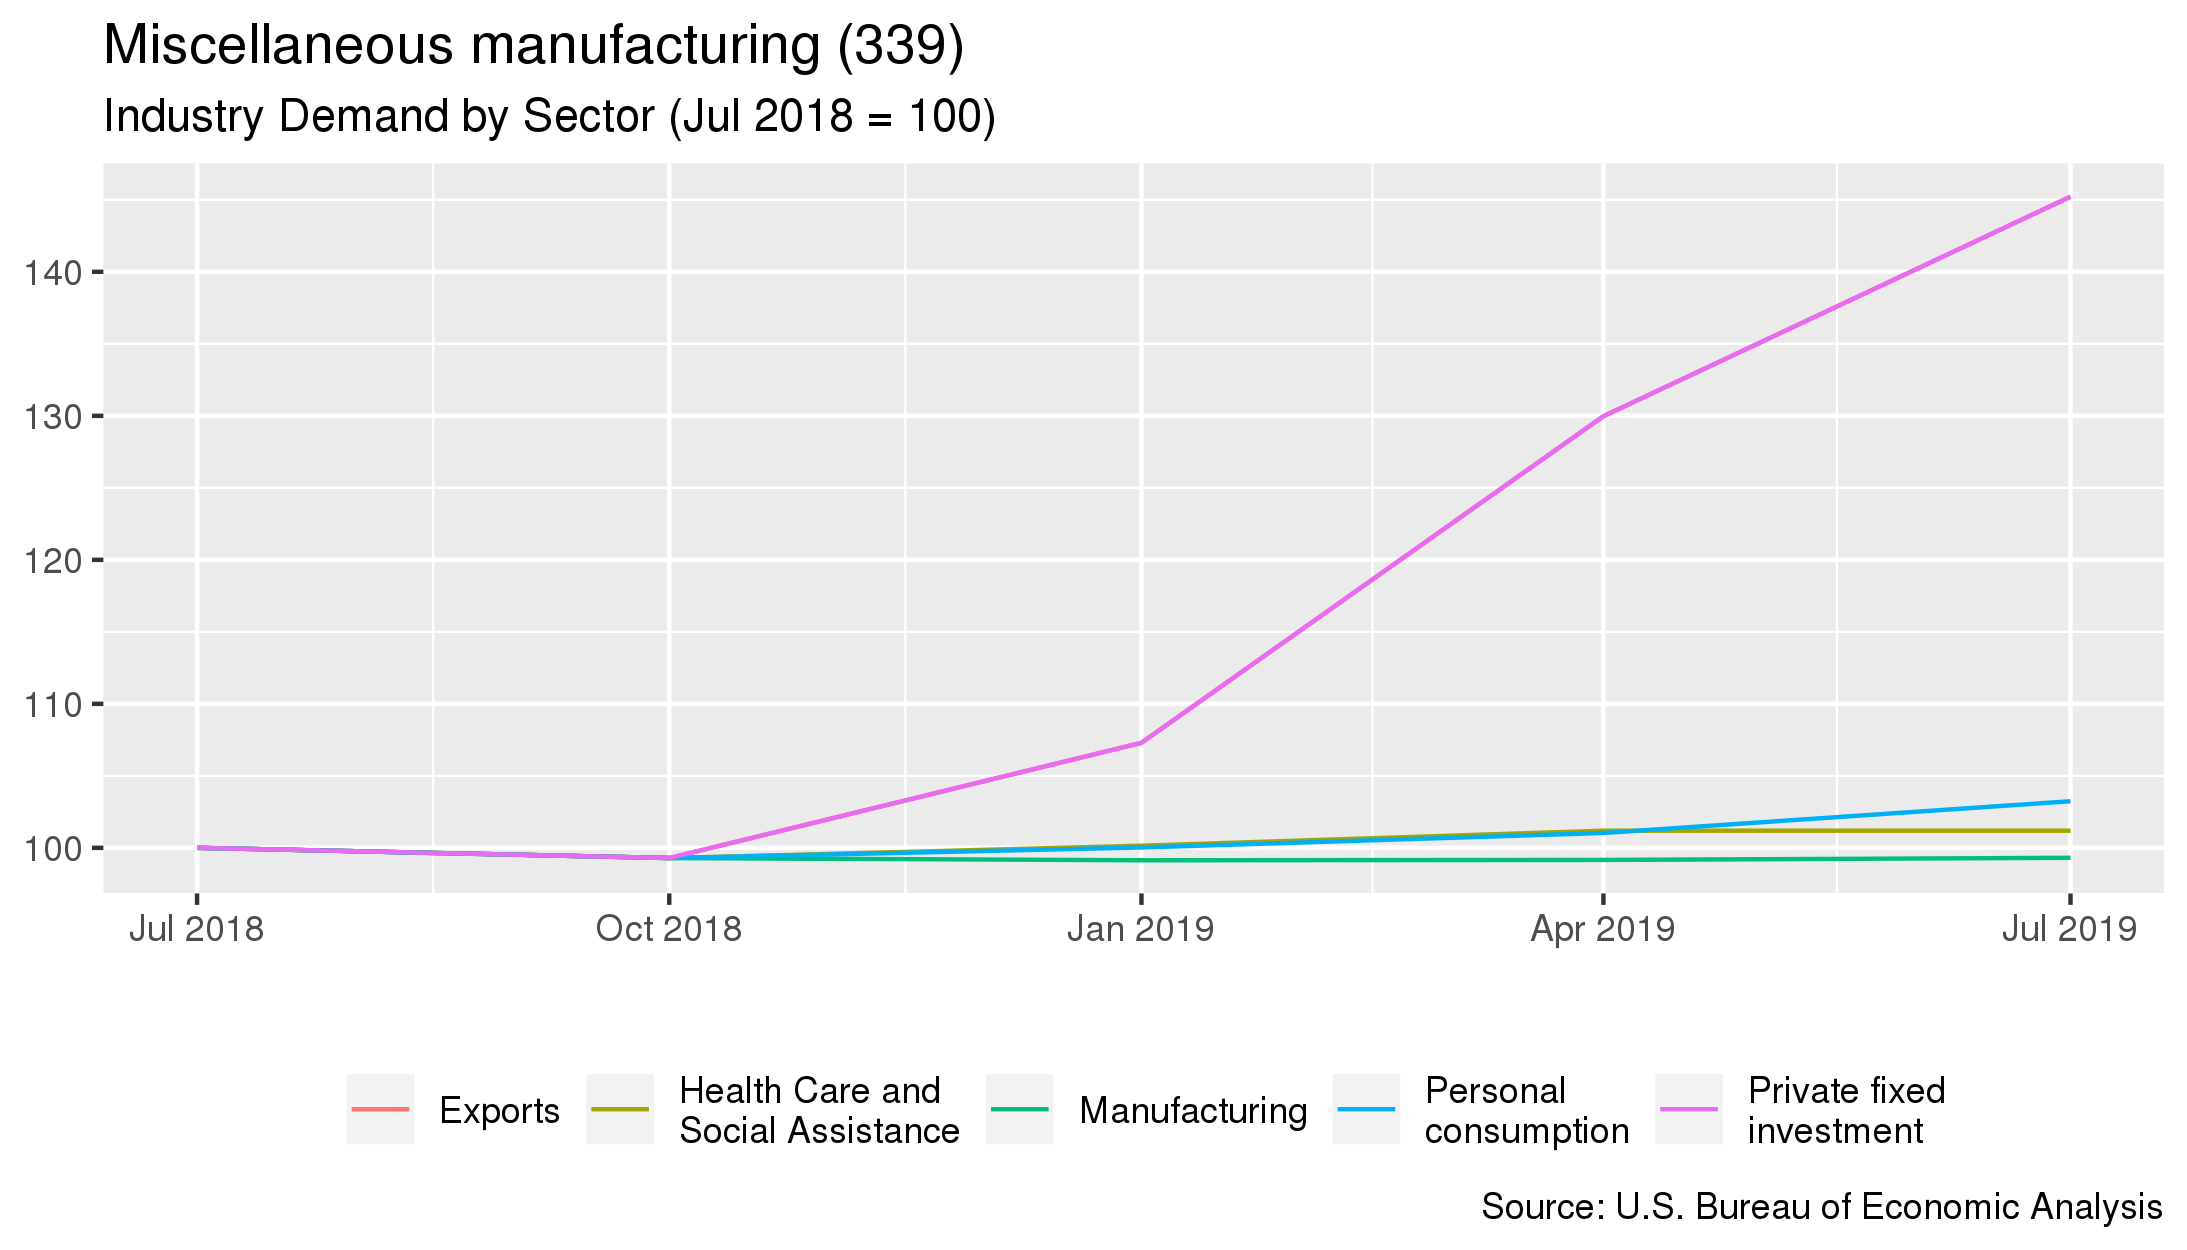
| Sector Name | Percentage of Demand | Annual Percent Change 6 |
|---|---|---|
| Personal consumption | 48.5% | +3.2% |
| Private fixed investment | 20.7% | +45.2% |
| Exports | 11.9% | +45.2% |
| Health Care and Social Assistance | 9.6% | +1.2% |
| Manufacturing | 3.1% | -0.7% |
- Pricing measured from January 2020.
- The BLS PPI used for this industry is PCU339---339---.
- Costs measured from January 2020
- Demand measured from July 2019