Funds, trusts, and other financial vehicles
Industry profile, February 2020
Sections: Description | Pricing | Costs | Demand | Appendix
This page is an industry profile for the Funds, trusts, and other financial vehicles industry. It provides a general economic overview of recent developments in the industry. This includes information on industry pricing, costs, and demand. Below you will find a description of what type of business establishments are included in this industry. For information on how to best utilize this industry profile please visit our Business Solutions.
Industry Description
Industries in the Funds, Trusts, and Other Financial Vehicles subsector group legal entities (i.e., funds, plans, and/or programs) organized to pool securities or other assets on behalf of shareholders or beneficiaries of employee benefit or other trust funds. The portfolios are customized to achieve specific investment characteristics, such as diversification, risk, rate of return, and price volatility. These entities earn interest, dividends, and other investment income, but have little or no employment and no revenue from the sale of services. Establishments with employees devoted to the management of funds are classified in Industry Group 5239, Other Financial Investment Activities.
This industry description was sourced from the North American Industry Classification System.
To download this data, or to learn more about how pricing is measured, please contact us.
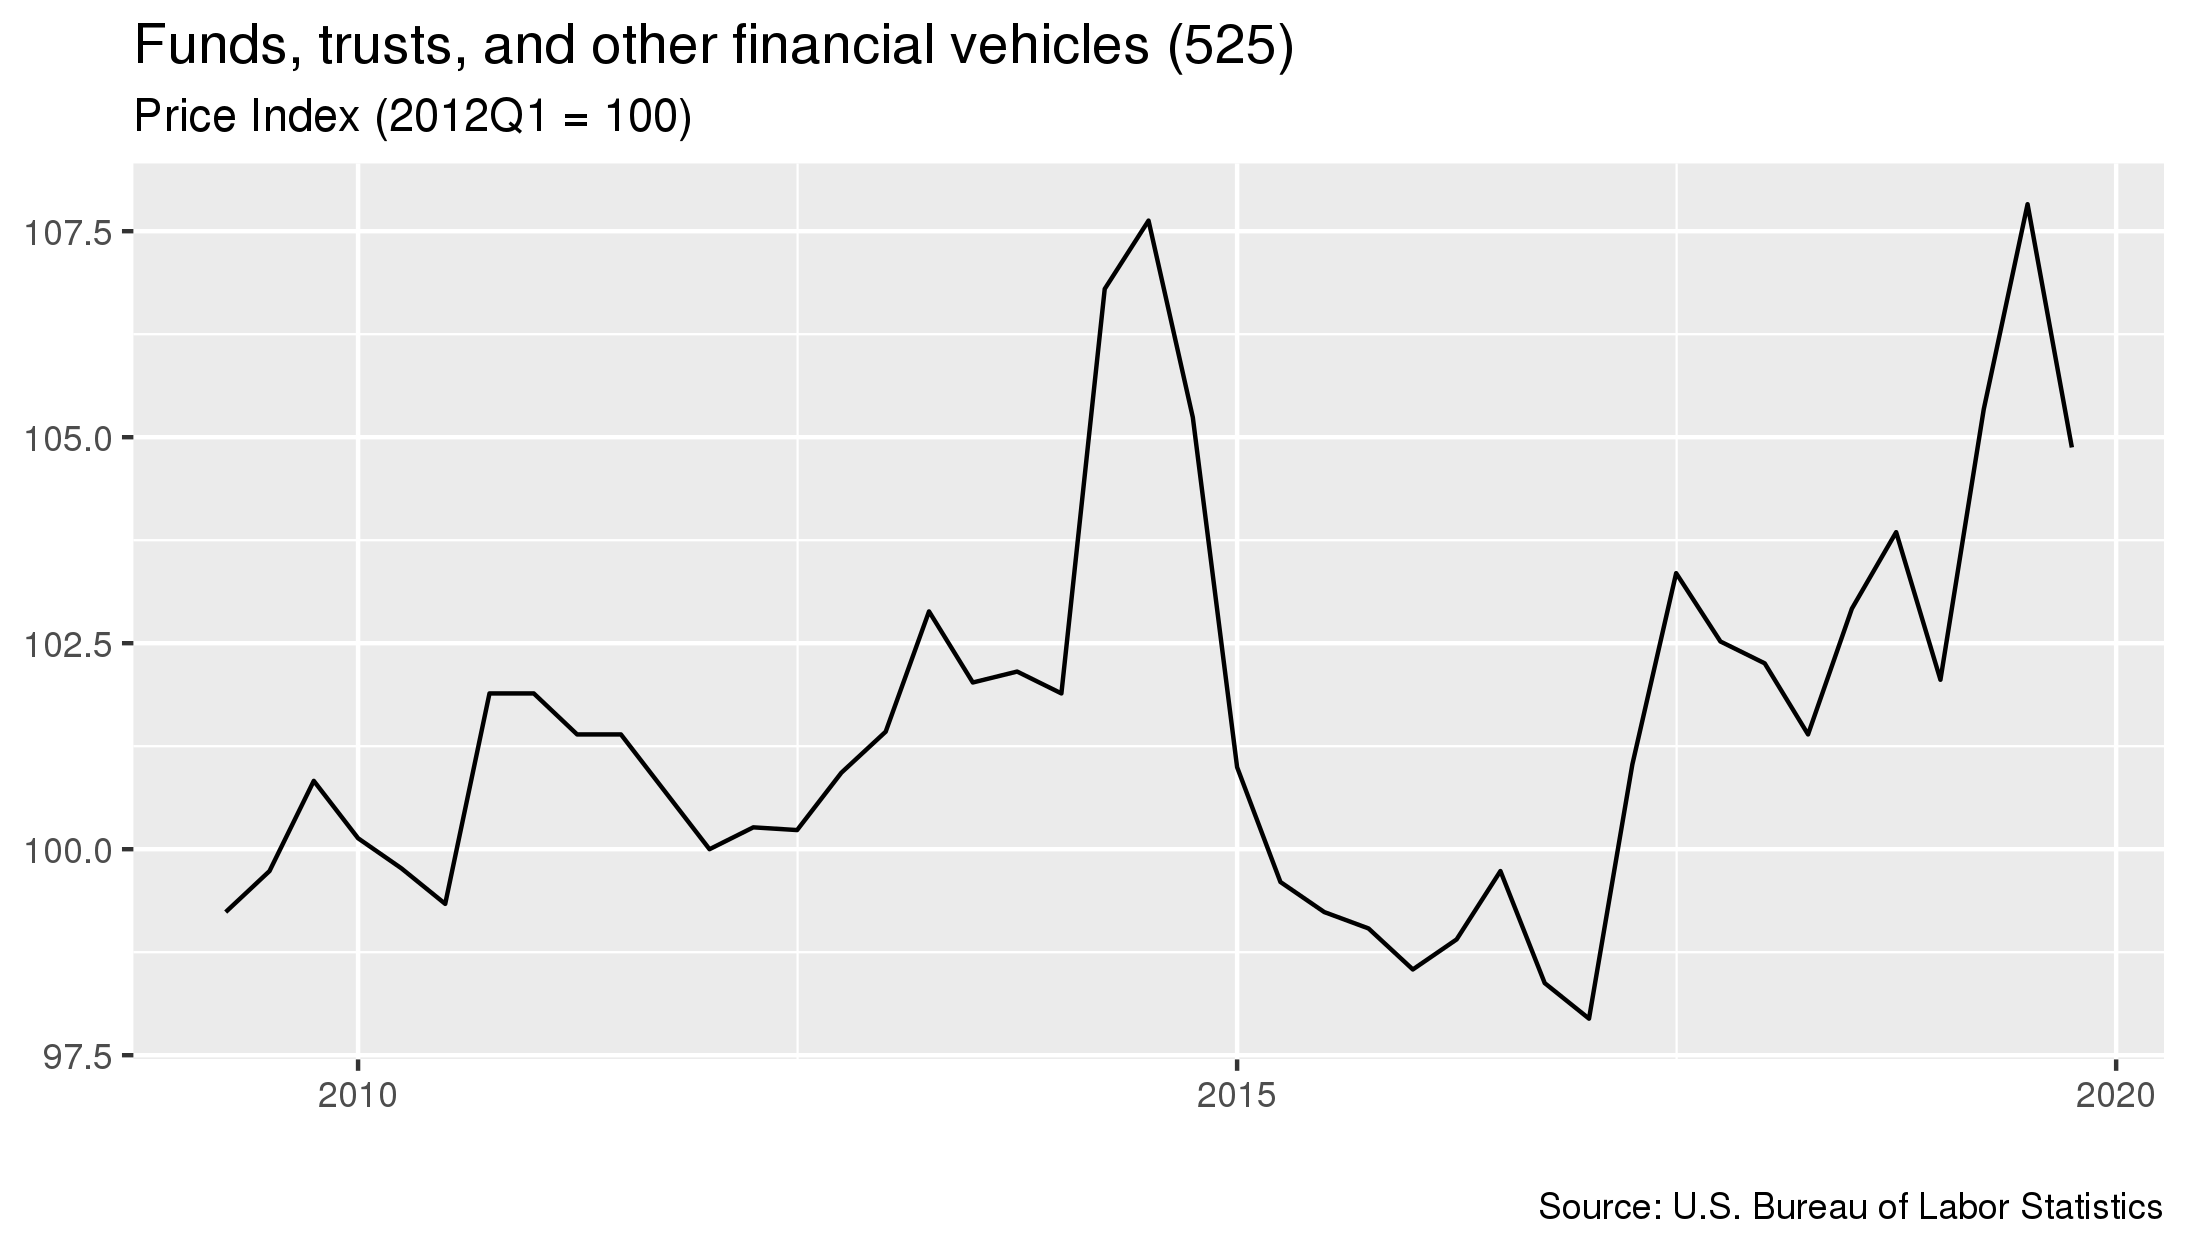
- As of January 2020, prices in this industry had decreased 2.7 percent since the previous quarter.
- From January 2019 to January 2020 prices in this industry increased 1 percent.
- Prices increased 5.9 percent in the five year period starting in January 2015 and ending in January 2020.
To download this data, or to learn more about how costs for this industry are measured, please contact us.
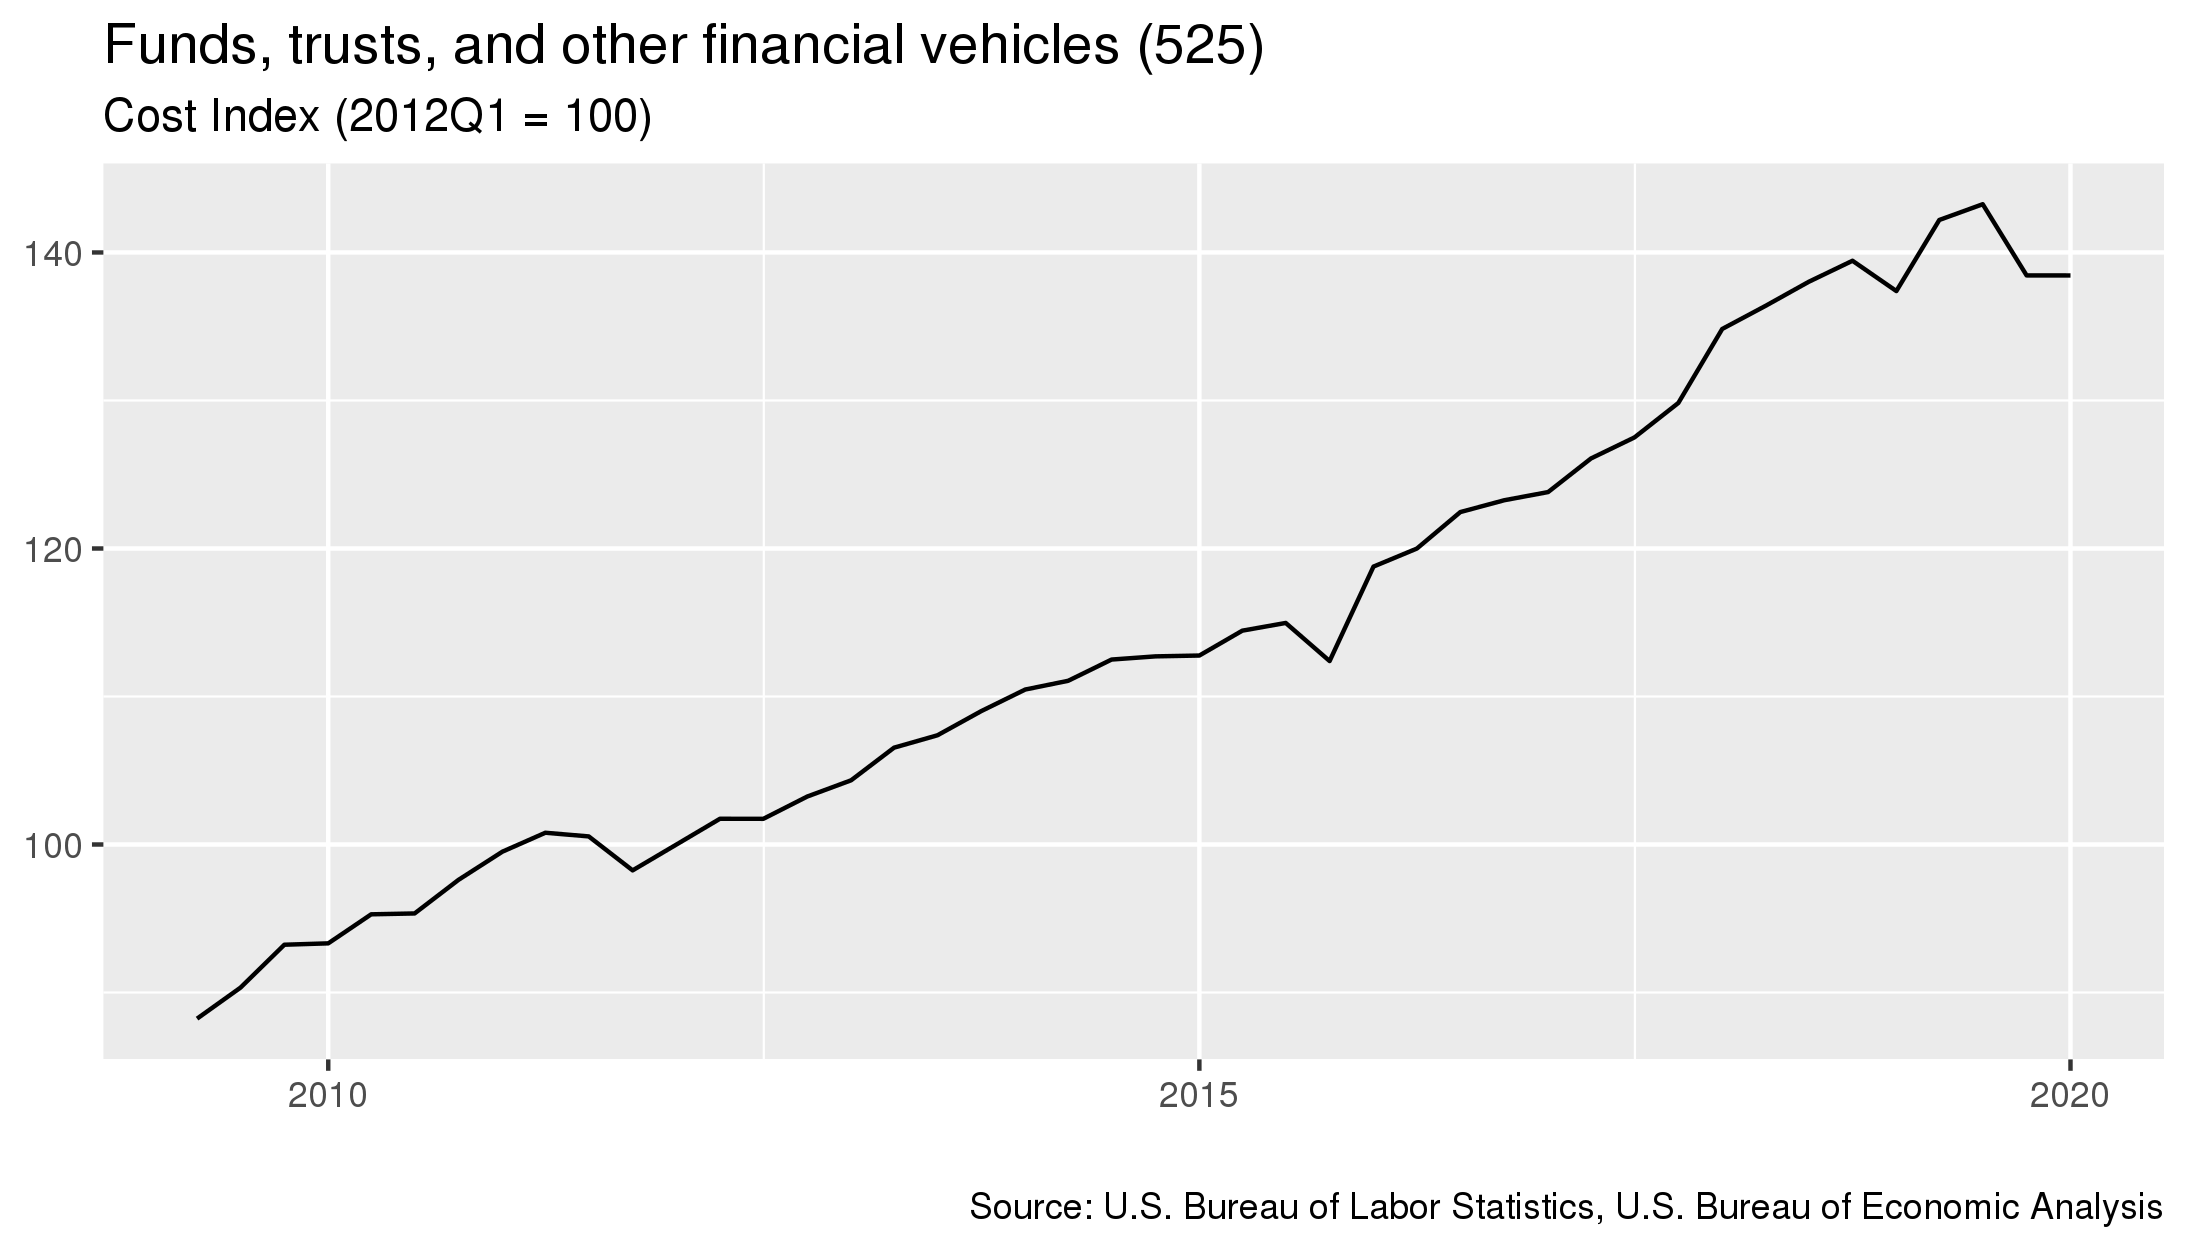
- As of January 2020, costs in this industry had 0 percent since the previous quarter.
- From January 2019 to January 2020 costs in this industry increased 0.8 percent.
- Costs increased 16.6 percent in the five year period starting in January 2015 and ending in January 2020.
For details on which industries are included in each sector, click here
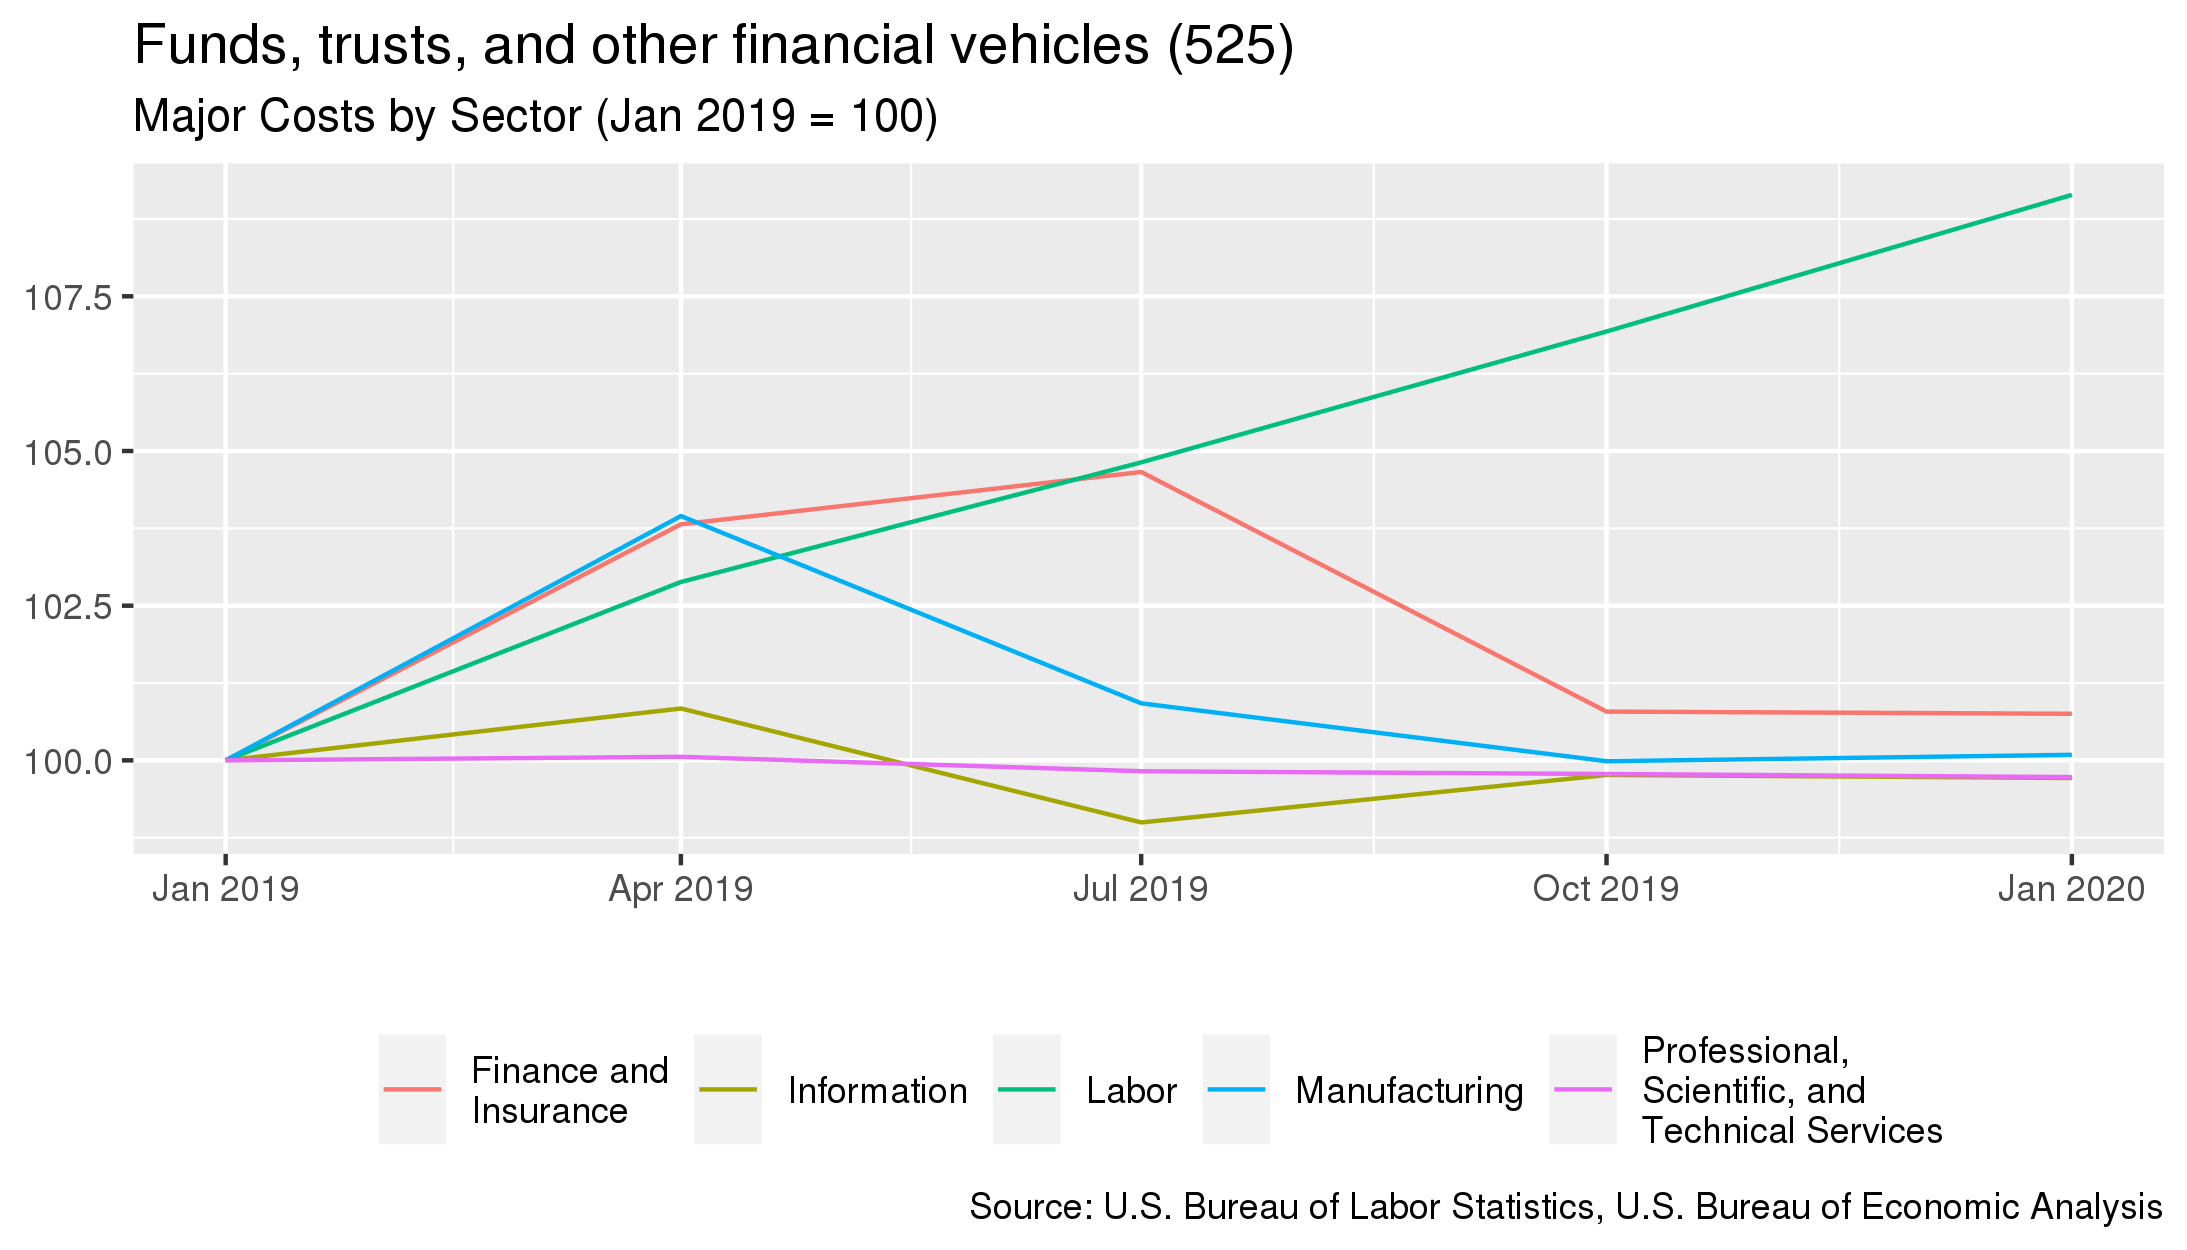
- The largest cost for this industry is purchases made to the Finance and Insurance sector. This sector accounts for 88.9% of the industry's overall costs.
- From January 2019 to January 2020, the largest change in costs for this industry were costs associated with purchases to the Labor sector. Costs associated with this sector increased 9.1%.
| Sector Name | Percentage of Costs | Annual Percent Change 4 |
|---|---|---|
| Finance and Insurance | 88.9% | +0.8% |
| Professional, Scientific, and Technical Services | 2.8% | -0.3% |
| Labor | 1.6% | +9.1% |
| Information | 1.4% | -0.3% |
| Manufacturing | 1.3% | +0.1% |
To download this data, or to learn more about how demand for this industry is measured, please contact us.
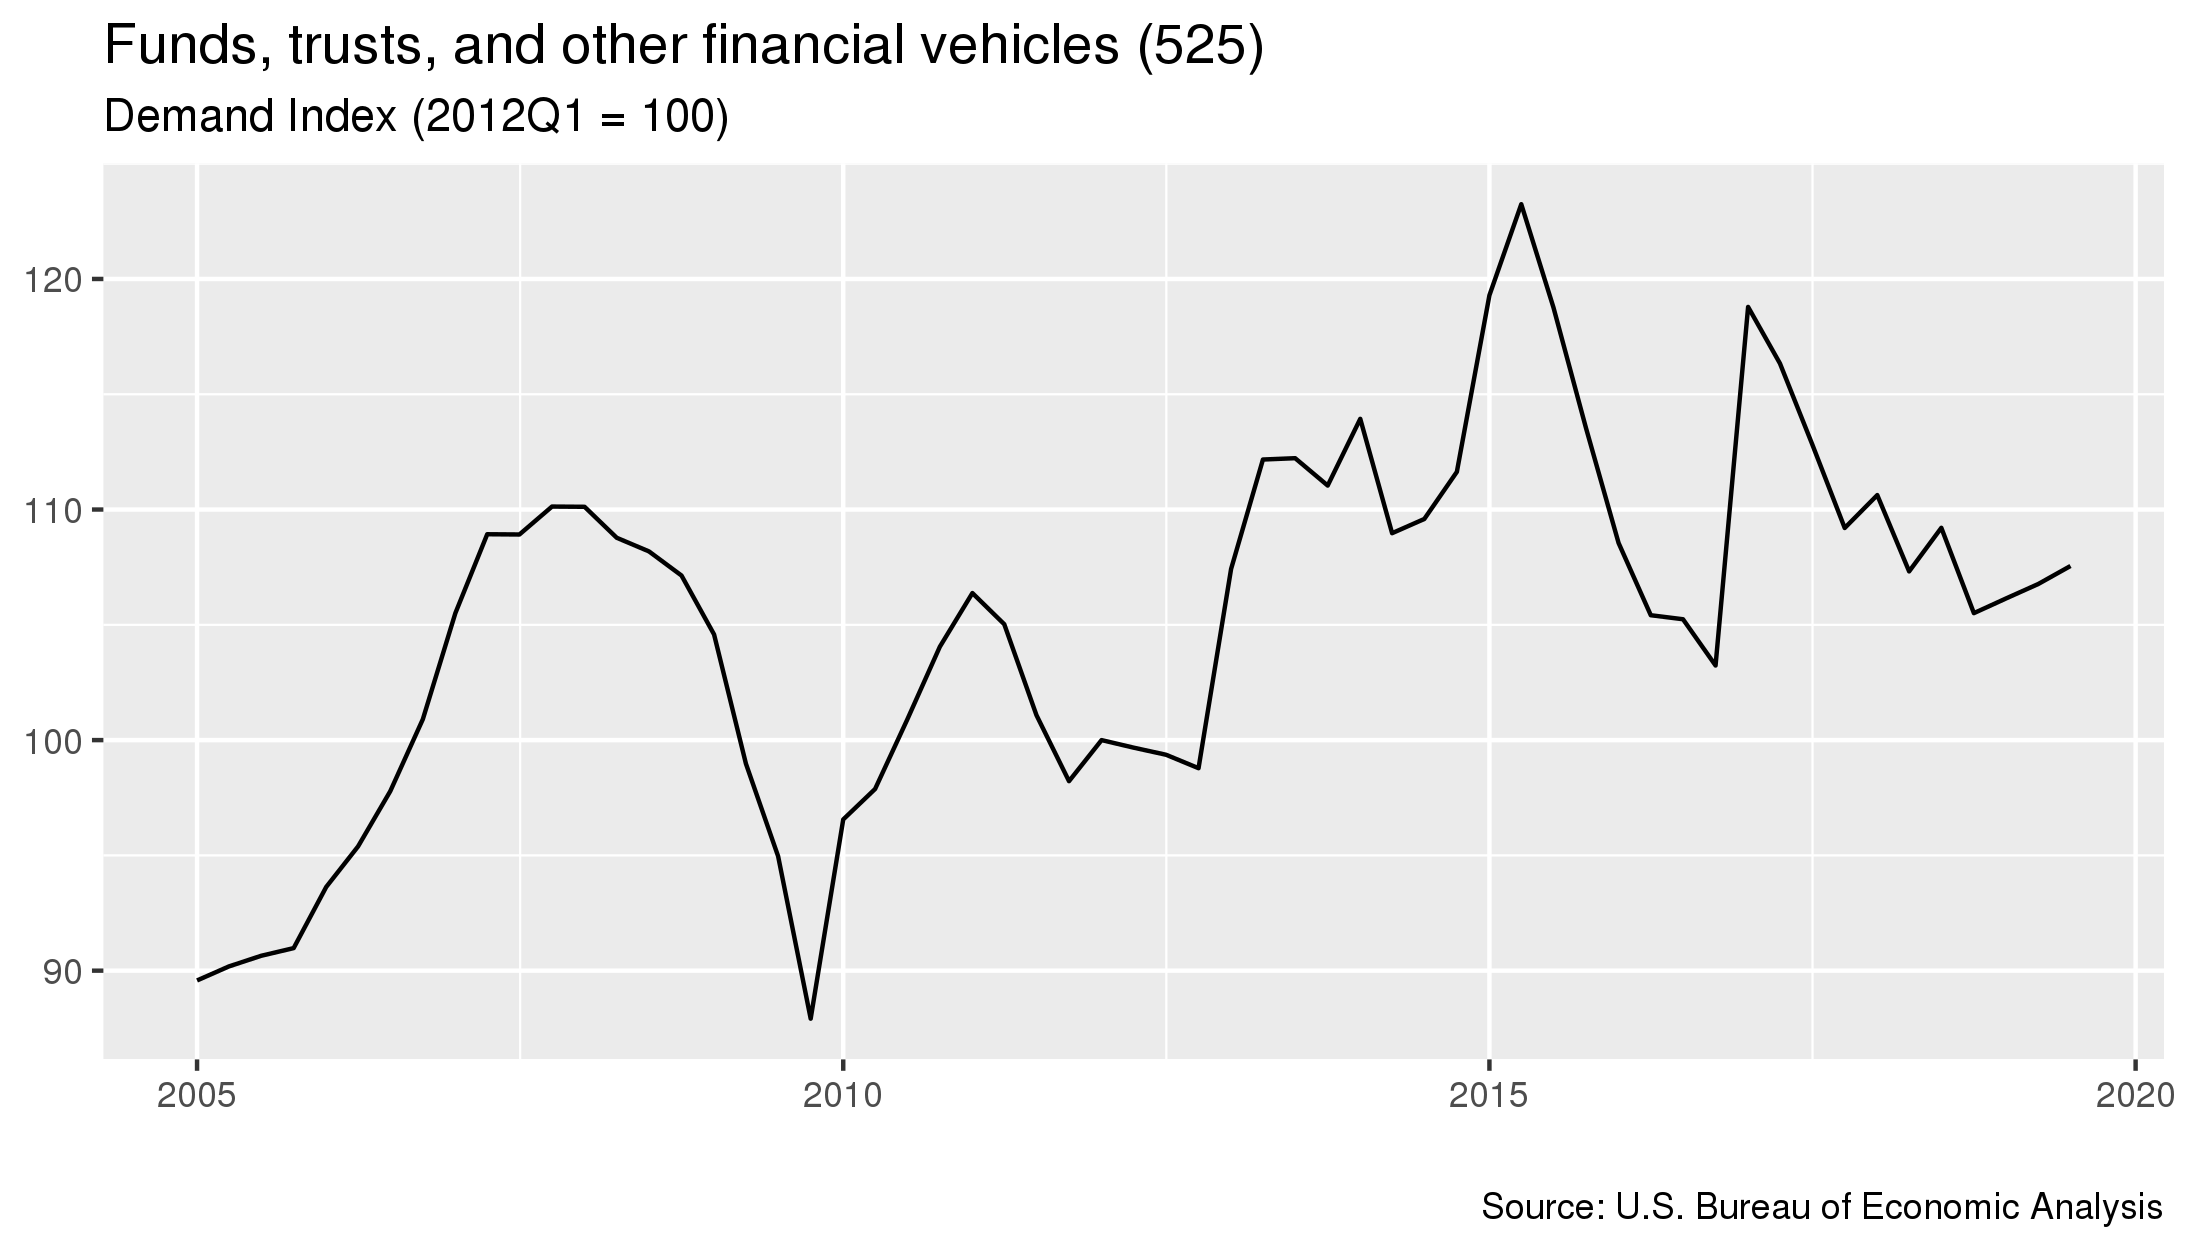
- As of July 2019, demand for this industry had increased 0.7 percent since the previous quarter.
- From July 2018 to January 2020 costs in this industry decreased 1.5 percent.
- Costs decreased 9.4 percent in the five year period starting in July 2014 and ending in July 2019.
For details on which industries are included in each sector, click here
- The sector that contributes the most to this industry's demand is the Personal consumption sector. This sector accounts for 87.9% of the industry's overall demand.
- From January 2019 to January 2020, the largest change in demand for this industry was from the Management of Companies and Enterprises sector, where demand increased 3.6%.
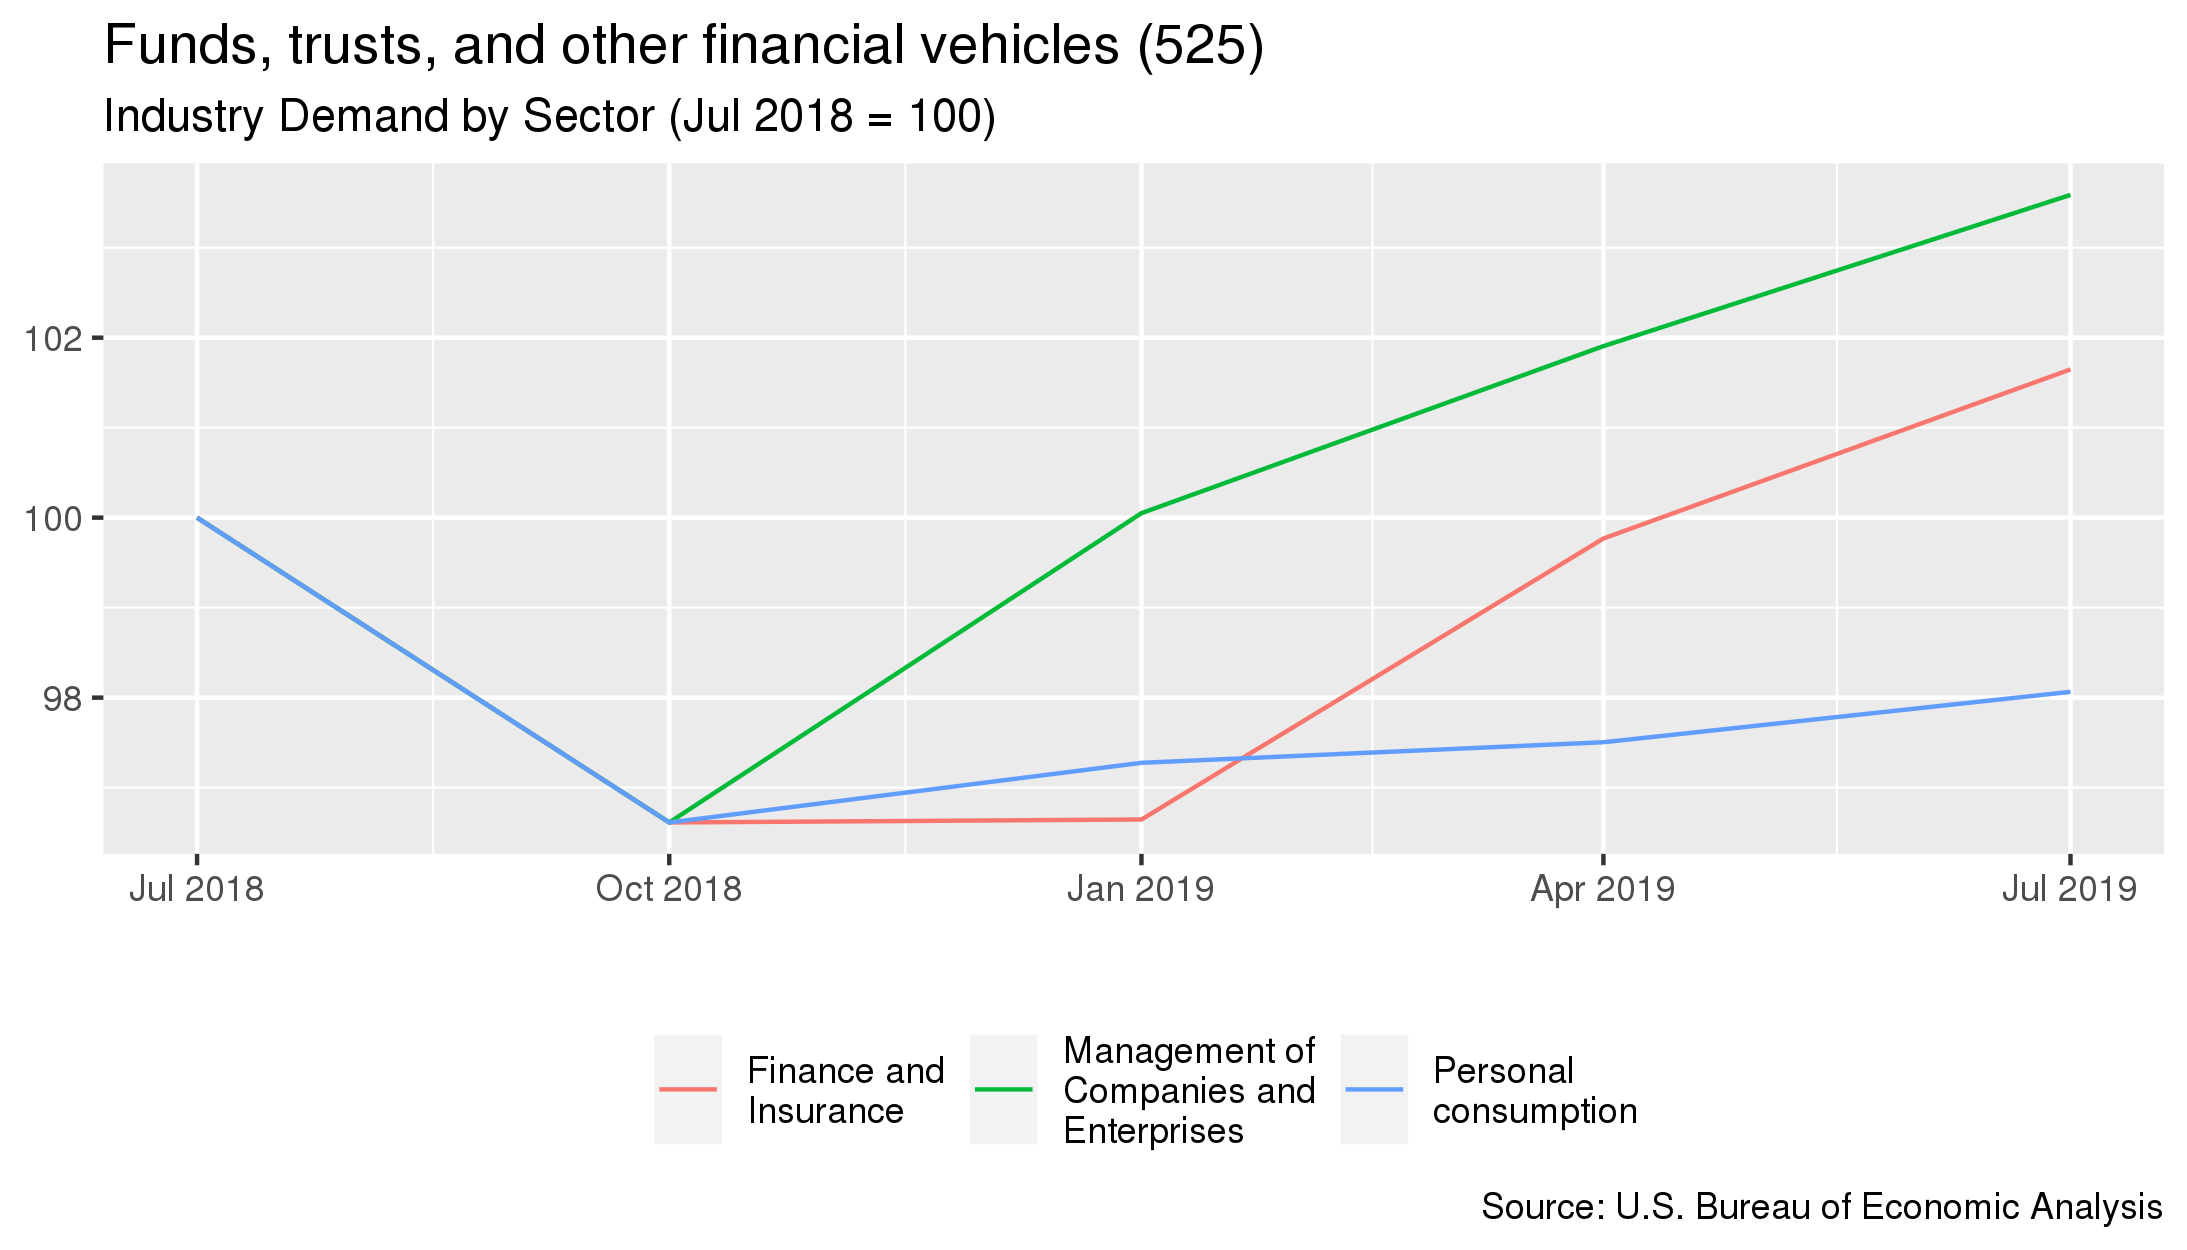
| Sector Name | Percentage of Demand | Annual Percent Change 6 |
|---|---|---|
| Personal consumption | 87.9% | -1.9% |
| Finance and Insurance | 12.1% | +1.6% |
| Management of Companies and Enterprises | 0% | +3.6% |
| - | - | - |
| - | - | - |
- Pricing measured from January 2020.
- The BLS PPI used for this industry is WPU393.
- Costs measured from January 2020
- Demand measured from July 2019