Food services and drinking places
Industry profile, February 2020
Sections: Description | Pricing | Costs | Demand | Appendix
This page is an industry profile for the Food services and drinking places industry. It provides a general economic overview of recent developments in the industry. This includes information on industry pricing, costs, and demand. Below you will find a description of what type of business establishments are included in this industry. For information on how to best utilize this industry profile please visit our Business Solutions.
Industry Description
Industries in the Food Services and Drinking Places subsector prepare meals, snacks, and beverages to customer order for immediate on-premises and off-premises consumption. There is a wide range of establishments in these industries. Some provide food and drink only, while others provide various combinations of seating space, waiter/waitress services, and incidental amenities, such as limited entertainment. The industries in the subsector are grouped based on the type and level of services provided. The industry groups are Special Food Services, such as food service contractors, caterers, and mobile food services; Drinking Places (Alcoholic Beverages); and Restaurants and Other Eating Places.
This industry description was sourced from the North American Industry Classification System.
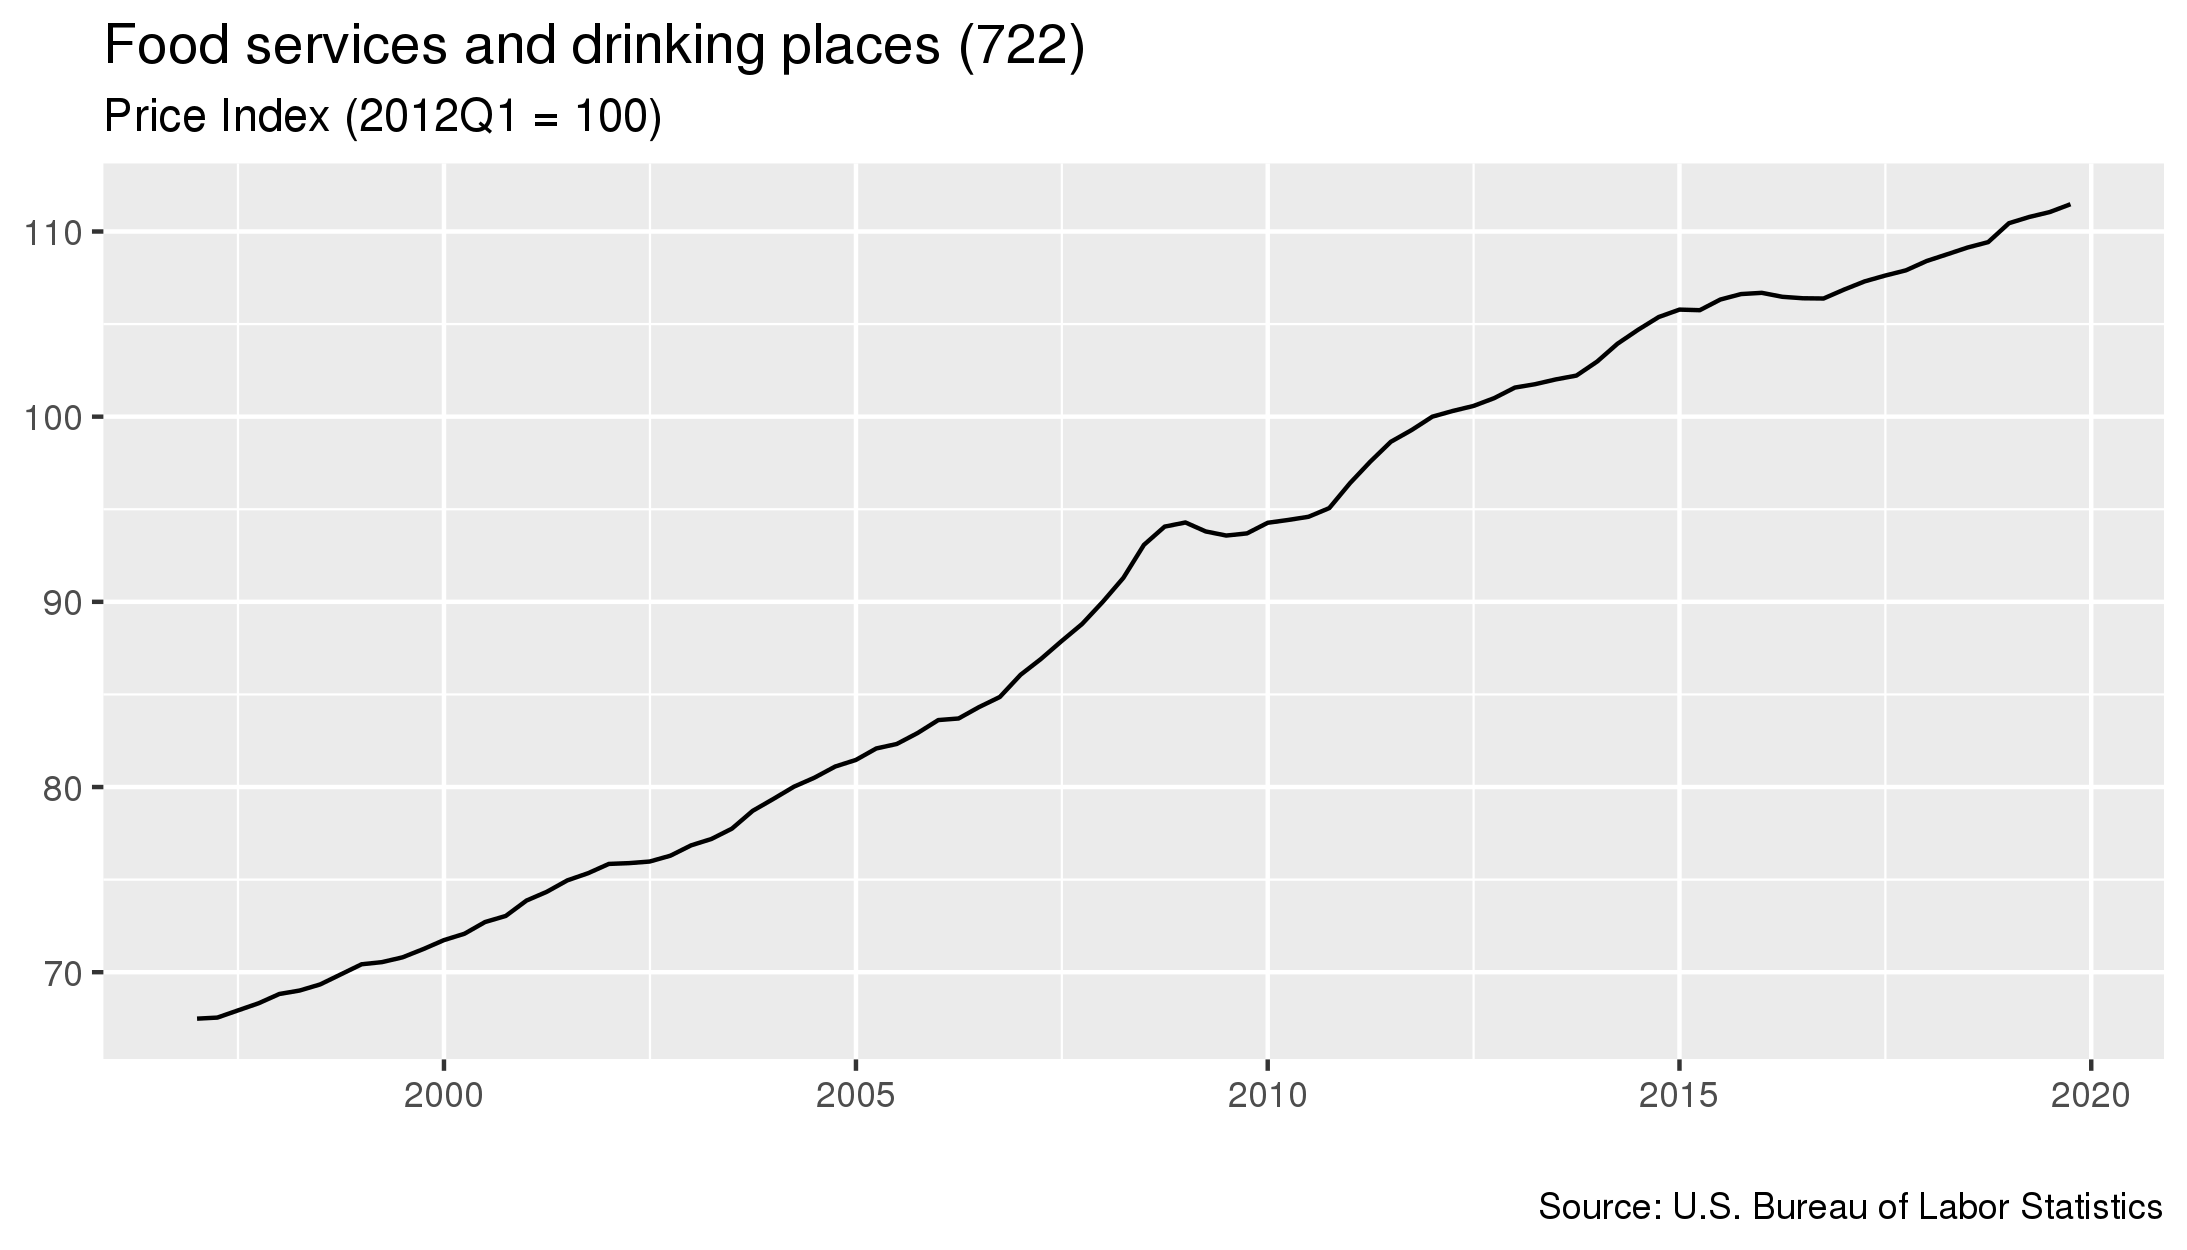
To download this data, or to learn more about how pricing is measured, please contact us.
- As of January 2020, prices in this industry had increased 0.4 percent since the previous quarter.
- From January 2019 to January 2020 prices in this industry increased 1.9 percent.
- Prices increased 4.6 percent in the five year period starting in January 2015 and ending in January 2020.
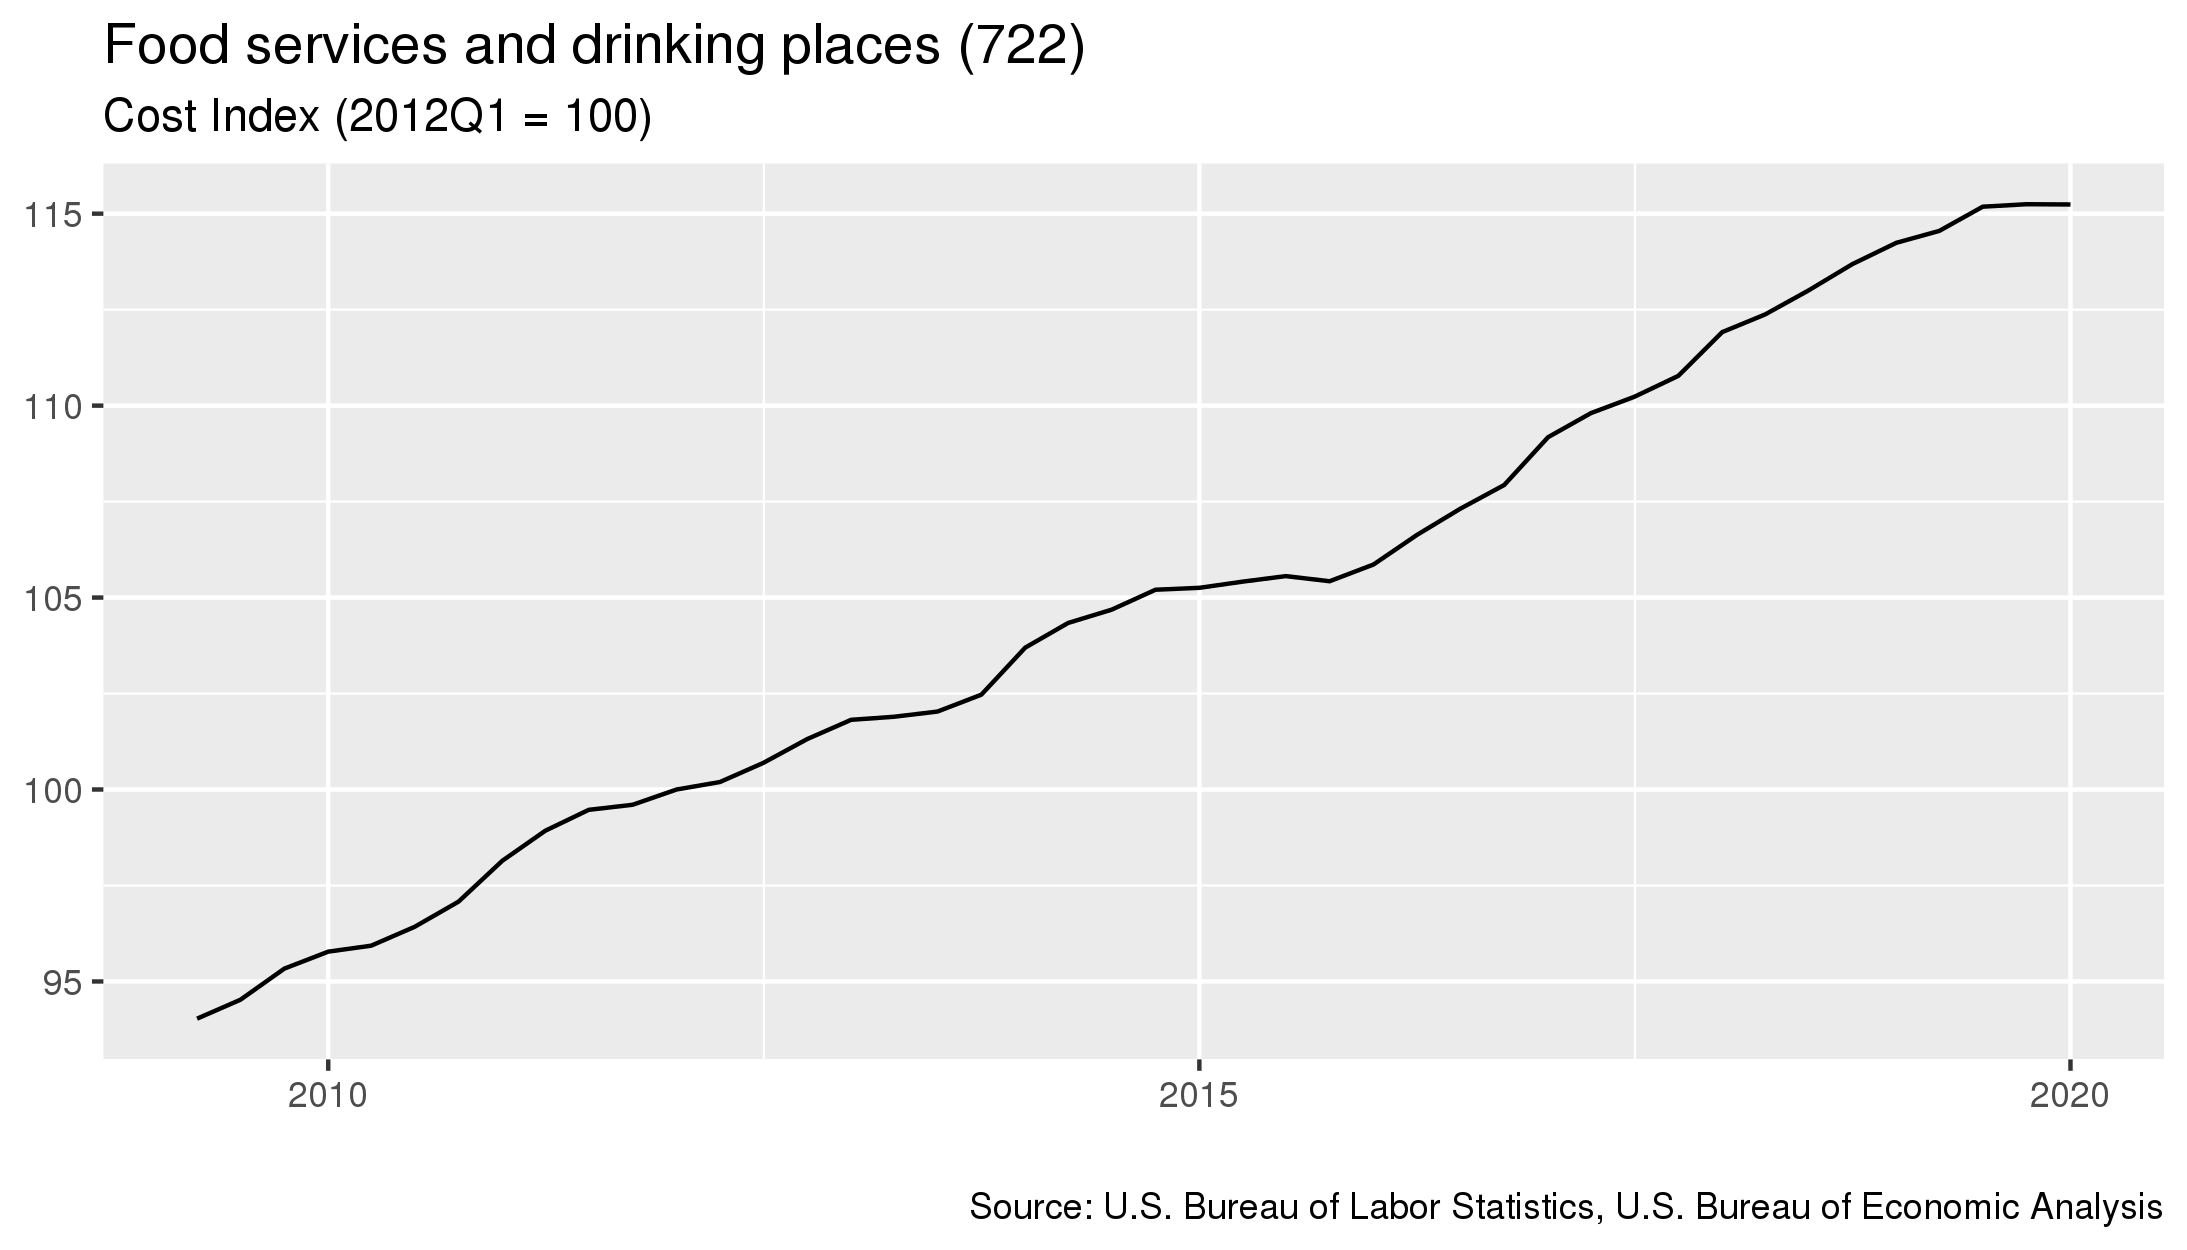
To download this data, or to learn more about how costs for this industry are measured, please contact us.
- As of January 2020, costs in this industry had 0 percent since the previous quarter.
- From January 2019 to January 2020 costs in this industry increased 0.9 percent.
- Costs increased 8.9 percent in the five year period starting in January 2015 and ending in January 2020.
For details on which industries are included in each sector, click here
- The largest cost for this industry is purchases made to the Labor sector. This sector accounts for 44.1% of the industry's overall costs.
- From January 2019 to January 2020, the largest change in costs for this industry were costs associated with purchases to the Manufacturing sector. Costs associated with this sector increased 3.4%.
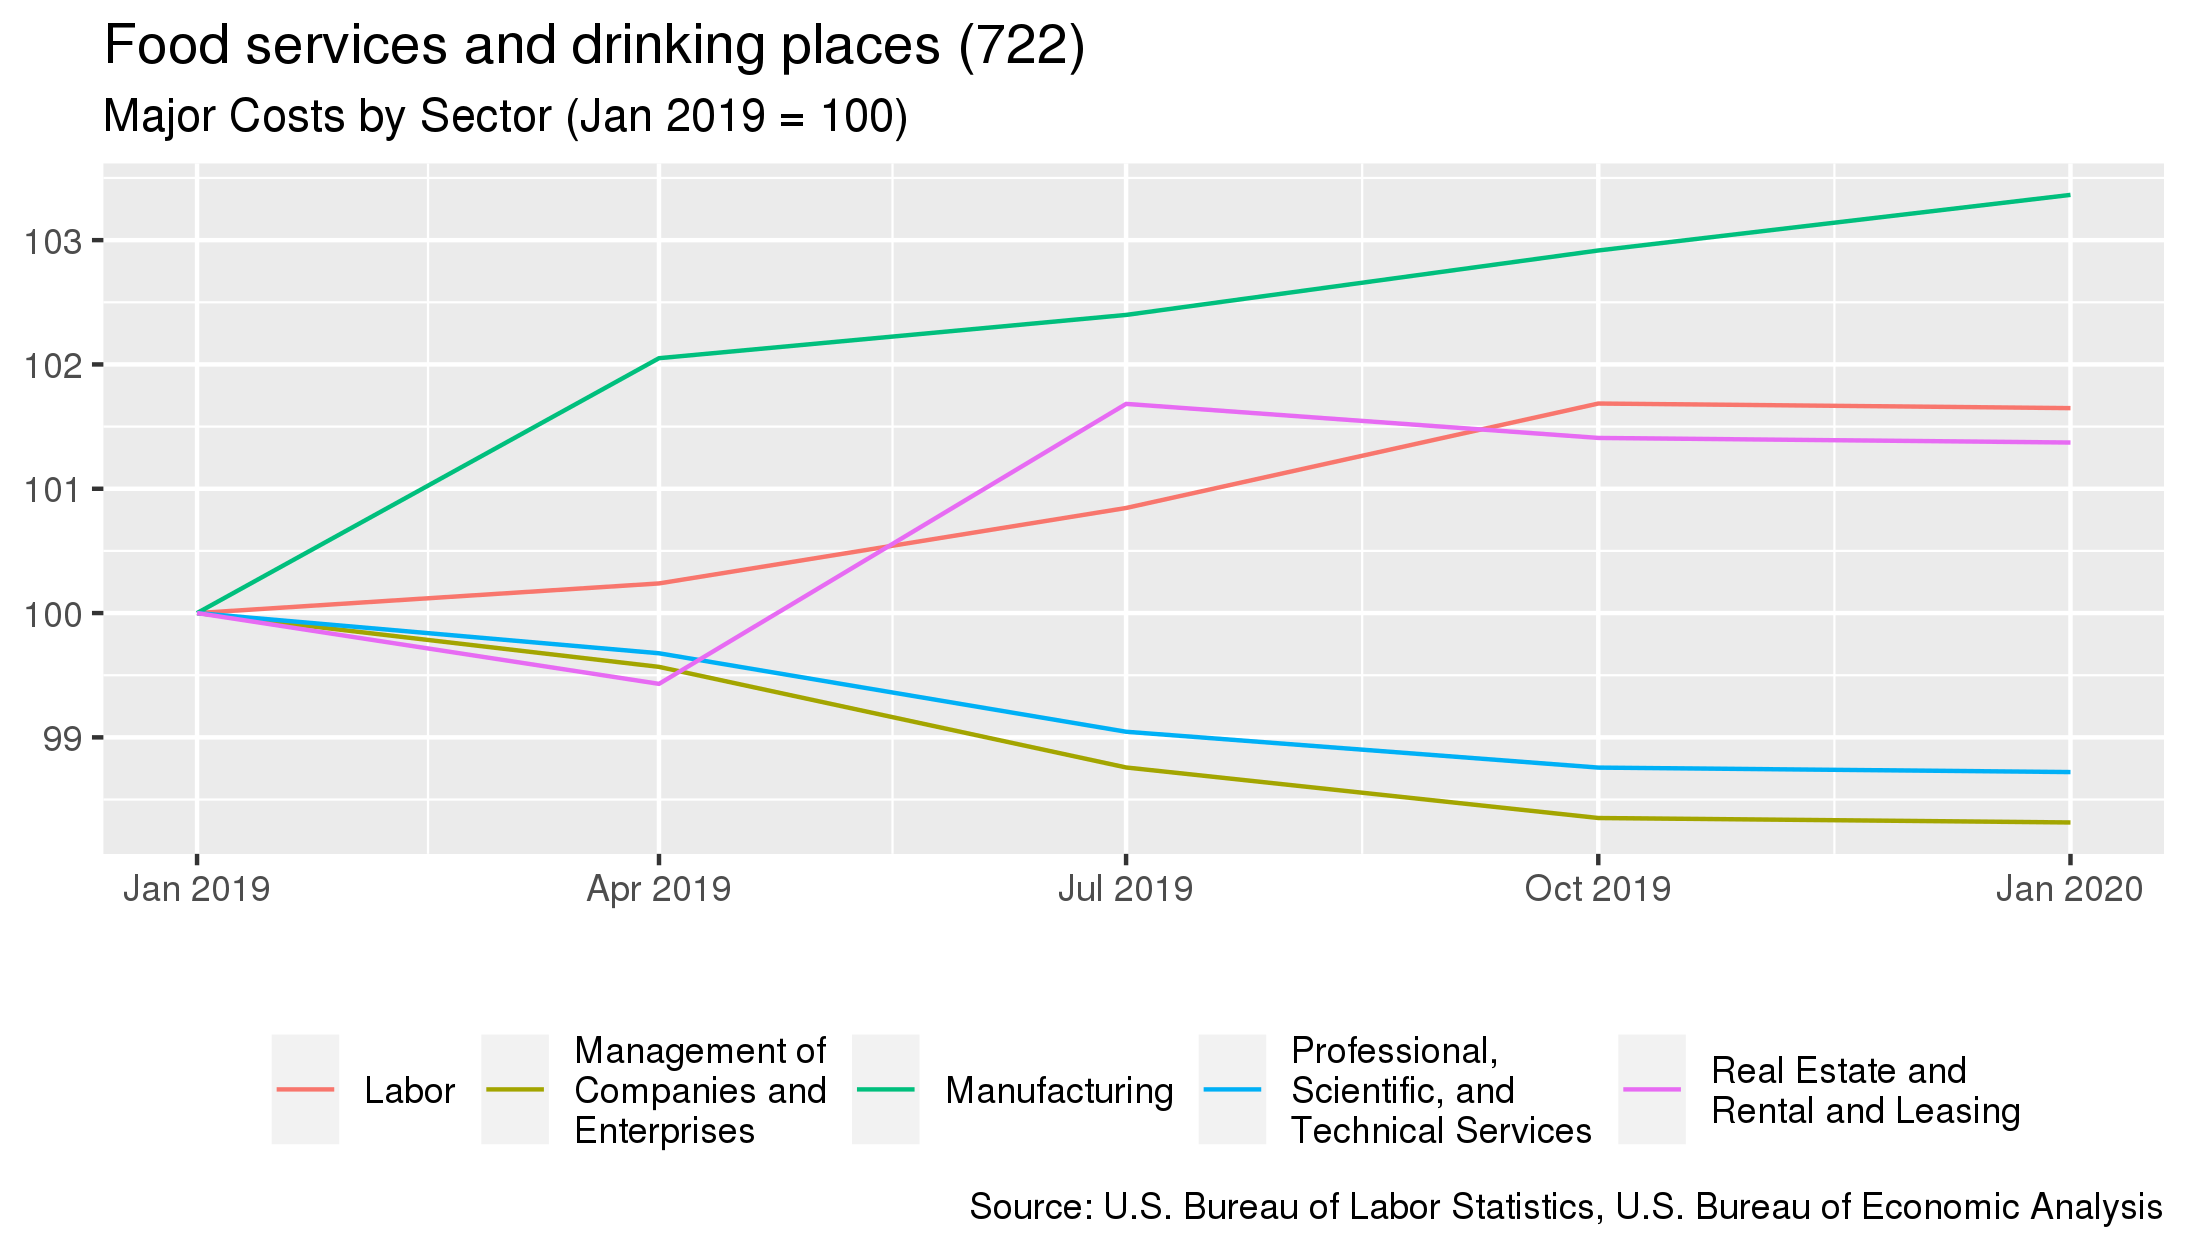
| Sector Name | Percentage of Costs | Annual Percent Change 4 |
|---|---|---|
| Labor | 44.1% | +1.6% |
| Manufacturing | 16.1% | +3.4% |
| Real Estate and Rental and Leasing | 12.7% | +1.4% |
| Management of Companies and Enterprises | 8.6% | -1.7% |
| Professional, Scientific, and Technical Services | 5% | -1.3% |
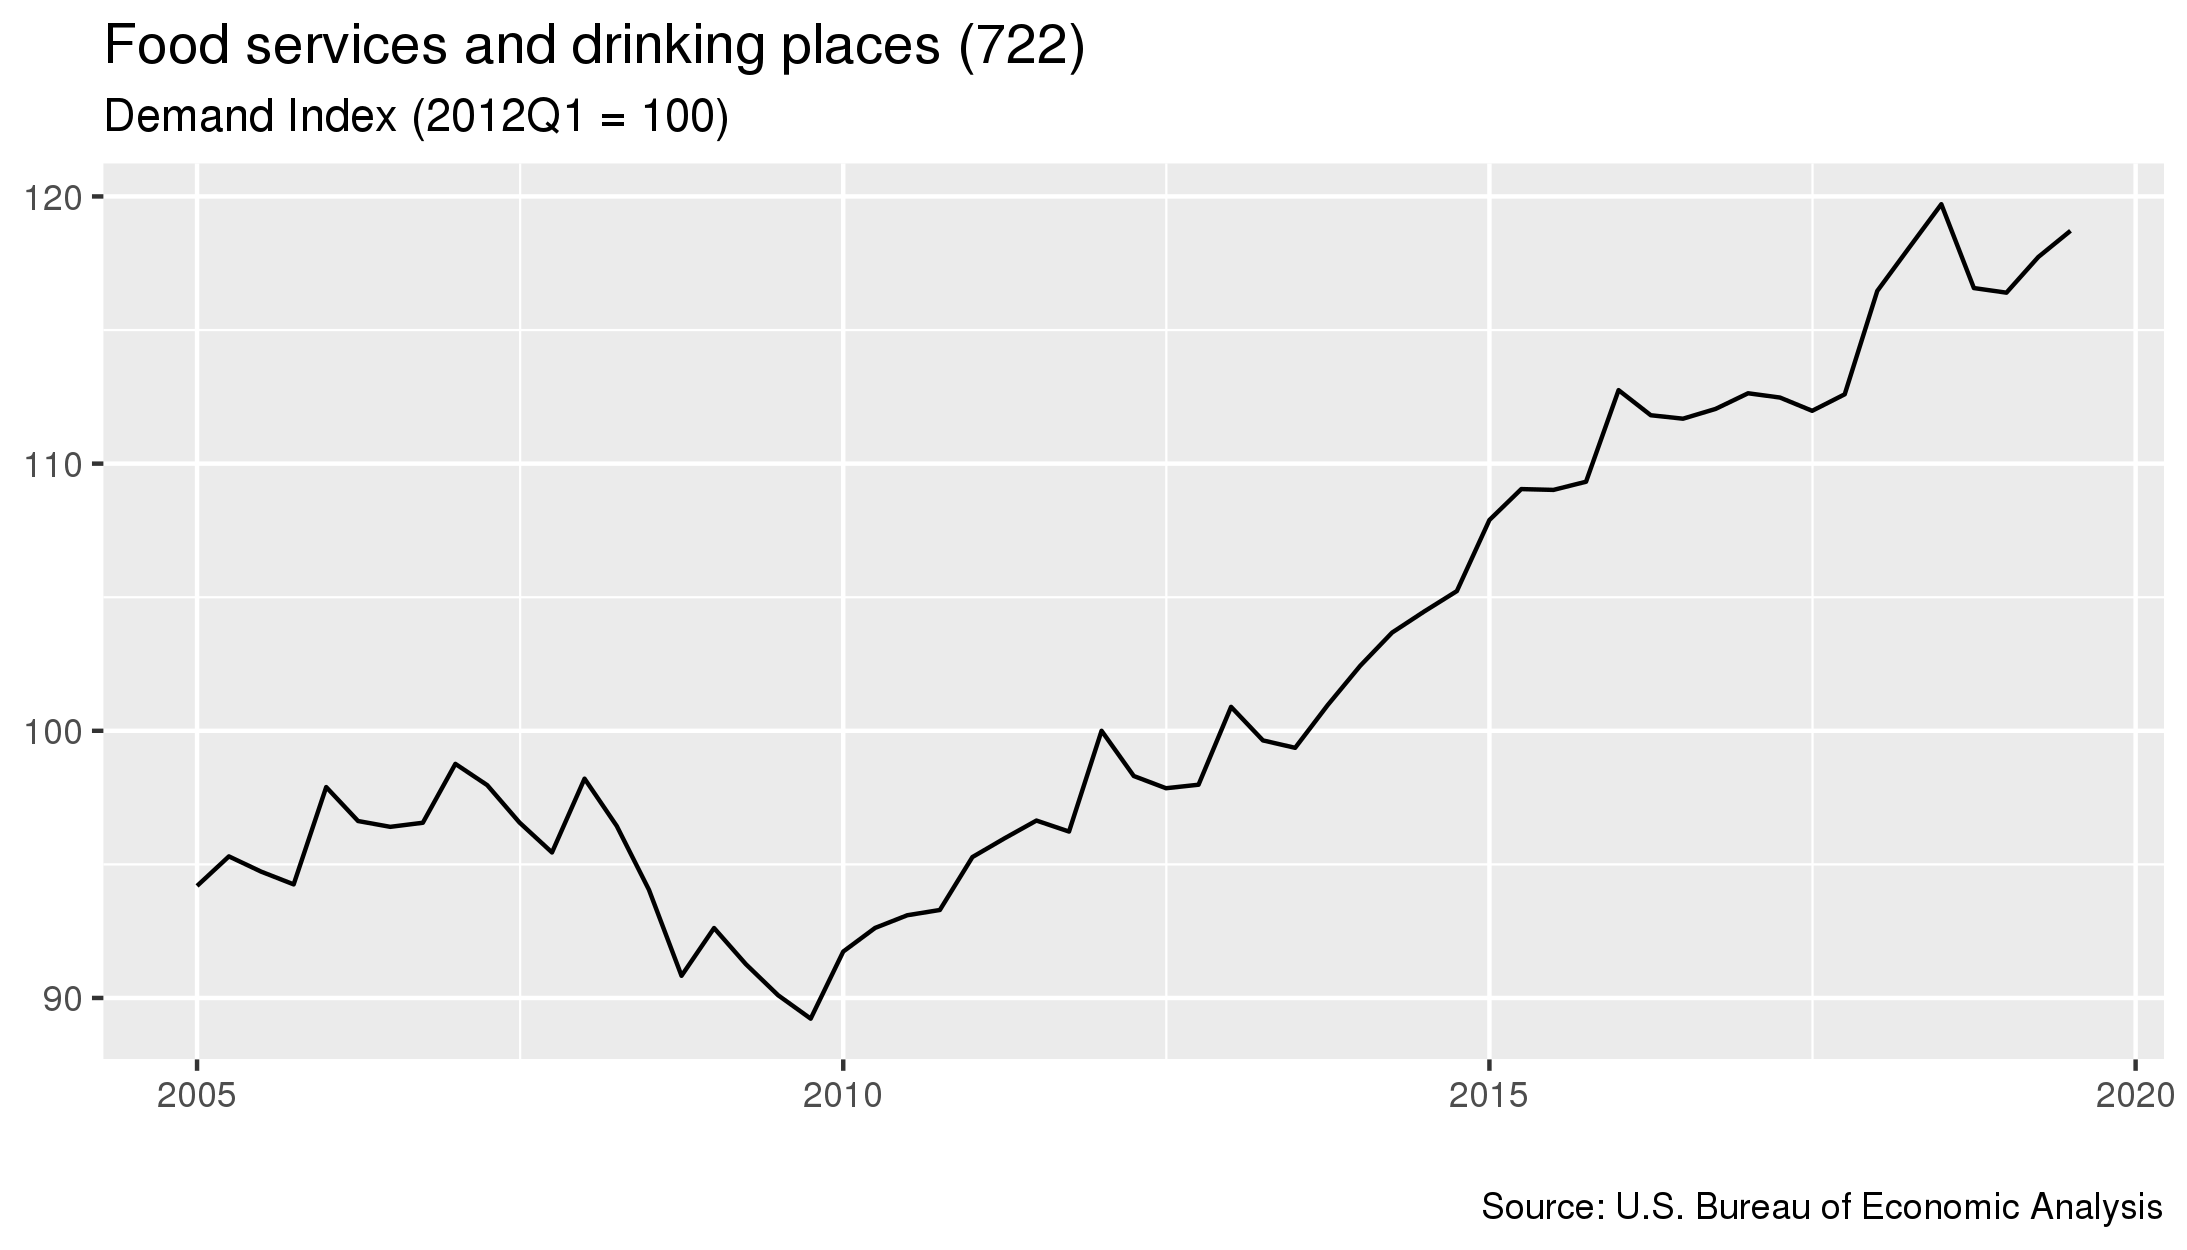
To download this data, or to learn more about how demand for this industry is measured, please contact us.
- As of July 2019, demand for this industry had increased 0.8 percent since the previous quarter.
- From July 2018 to January 2020 costs in this industry decreased 0.8 percent.
- Costs increased 8.9 percent in the five year period starting in July 2014 and ending in July 2019.
For details on which industries are included in each sector, click here
- The sector that contributes the most to this industry's demand is the Personal consumption sector. This sector accounts for 78.5% of the industry's overall demand.
- From January 2019 to January 2020, the largest change in demand for this industry was from the Real Estate and Rental and Leasing sector, where demand increased 1.1%.
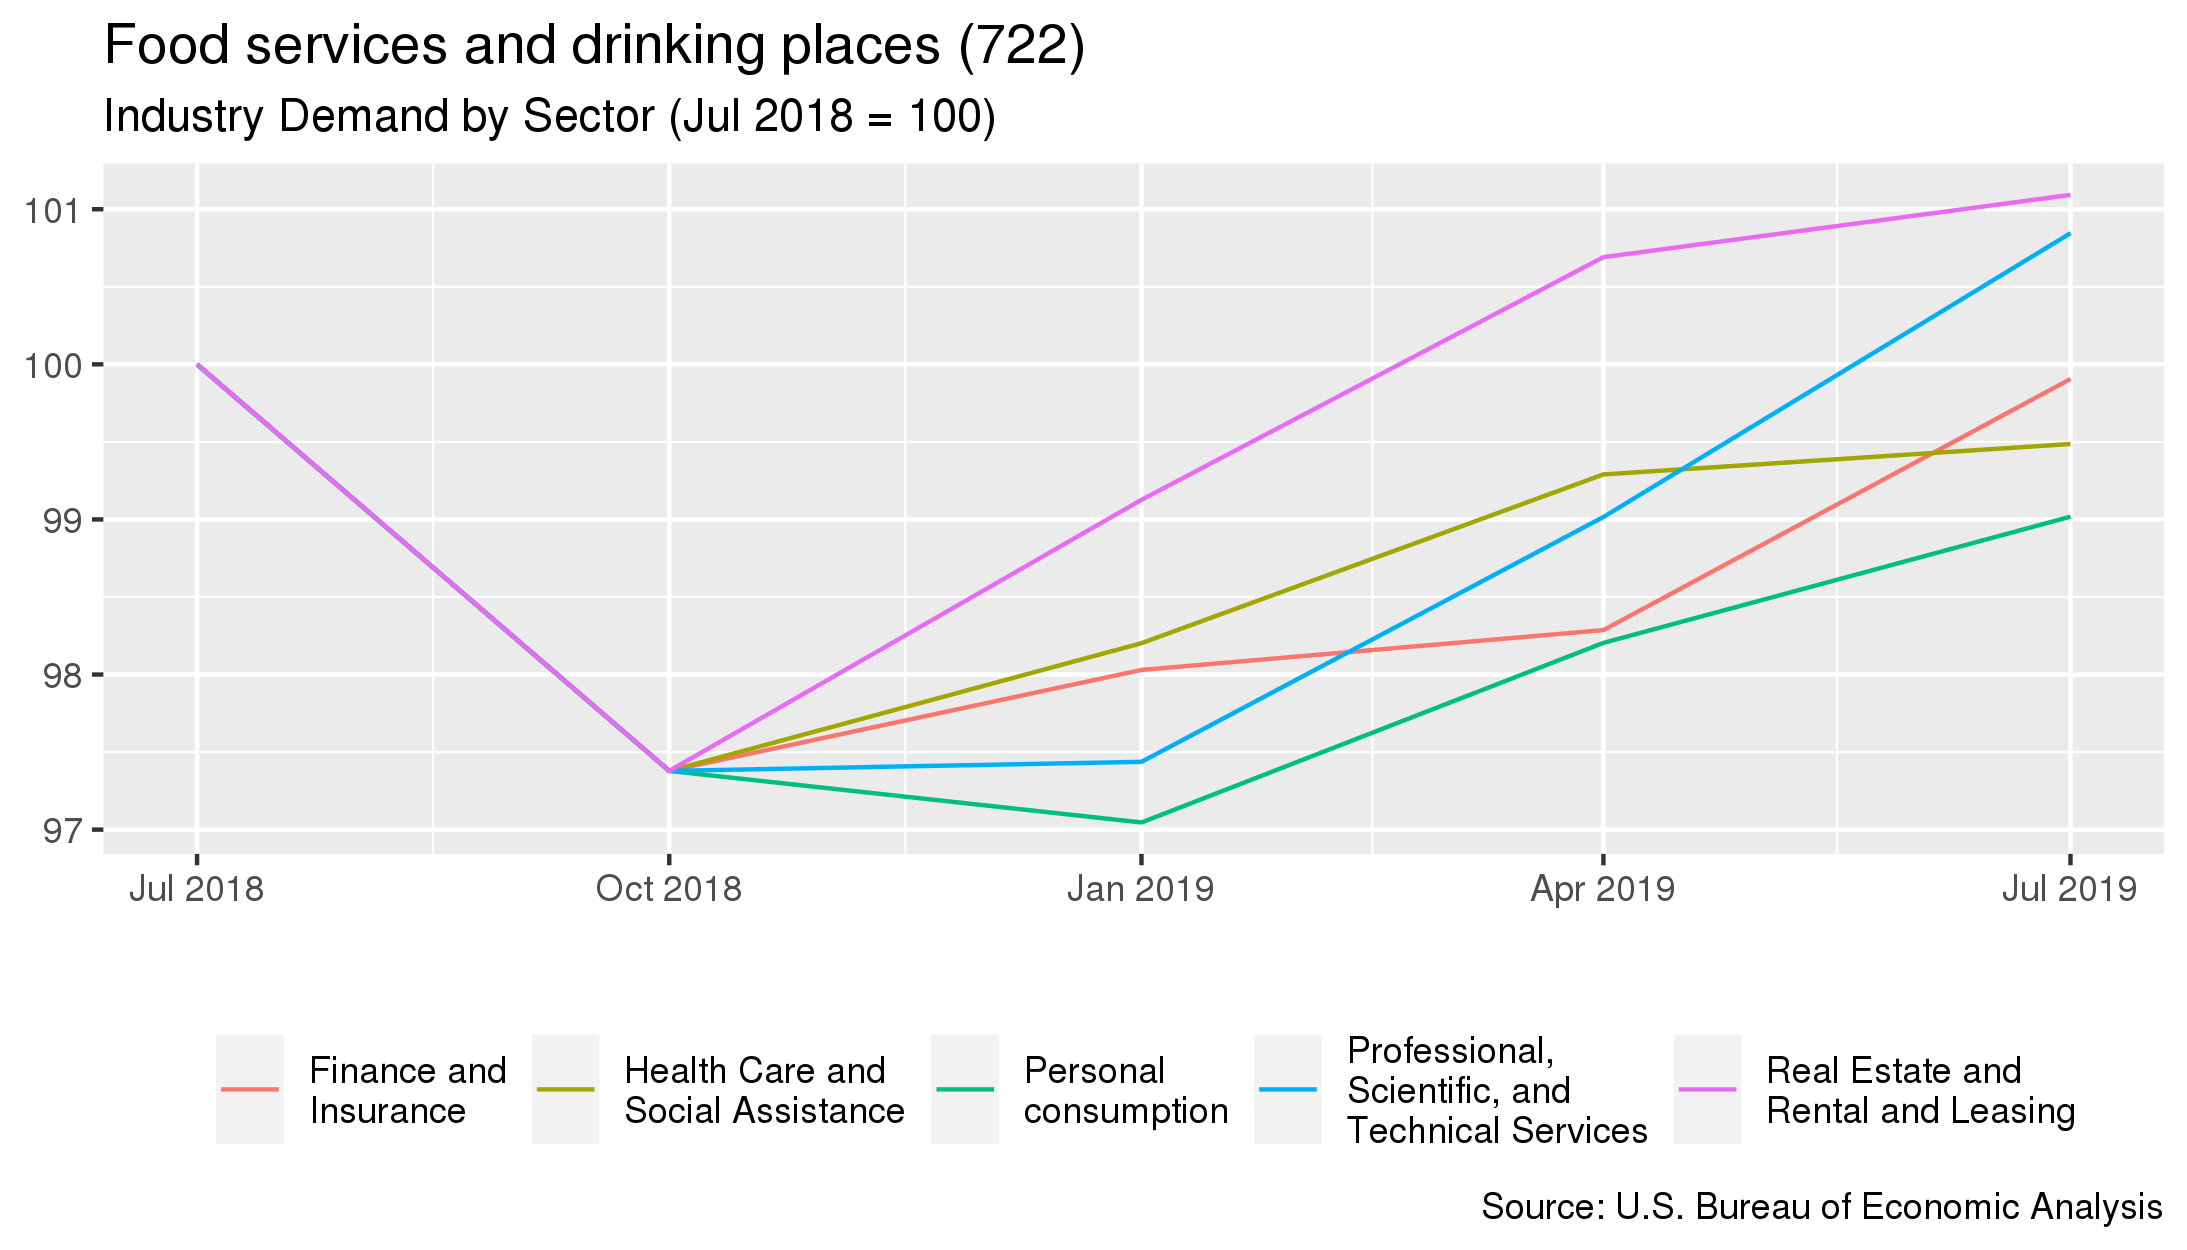
| Sector Name | Percentage of Demand | Annual Percent Change 6 |
|---|---|---|
| Personal consumption | 78.5% | -1% |
| Health Care and Social Assistance | 4.7% | -0.5% |
| Real Estate and Rental and Leasing | 3% | +1.1% |
| Professional, Scientific, and Technical Services | 2.6% | +0.8% |
| Finance and Insurance | 1.7% | -0.1% |
- Pricing measured from January 2020.
- The BLS PPI used for this industry is CUUR0000SAF.
- Costs measured from January 2020
- Demand measured from July 2019